Best time to go to Jamaica for a perfect weather and where to go?
When is the best time to go to Jamaica?
The best time to visit Jamaica is from December to March, but a trip is possible all year round. Indeed, the island is located between the Tropic of Cancer and the equator, in the Caribbean Sea, making it warm regardless of the season.
Your choice of vacation dates in Jamaica will mainly depend on what you want to do and the experiences you want to have there:
- For hiking or trekking in the beautiful Blue Mountains range in the center of the island, prefer the dry season between November and April. You can attempt the ascent of the summit, Blue Mountain Peak, which rises to 2,256 meters above sea level. However, it is during the rainy season, from May to November, that the waterfalls flow the most, so it's entirely possible to take short walks to swim in a magnificent setting!
- For lounging on the beach and relaxing, Jamaica is a true paradise all year round. Even during the rainy season from May to November, showers can be intense but brief, having little impact on the average sunshine of 7 to 9 hours per day. Perfect for lazing under an umbrella and taking a dip in the Caribbean Sea!
- For scuba diving or snorkeling, opt for the months between June and September. This is the best period for excellent visibility, up to 35 meters, and calm waters.
- When to go to Jamaica for surfing? From December to March, and from June to August, Boston Bay and Long Bay offer ideal conditions with perfect waves.
- To spot humpback whales, the official season is from December to April, but January and February are the best months. These sea giants migrate to warm waters during winter to breed and give birth to their calves.
- If you want to attend reggae festivals, the summer season in July and August is perfect.
August and December are the peak tourist seasons in Jamaica, leading to a significant increase in prices, whether for flights or accommodations. If you have a tight budget, it's better to go to Jamaica in May, June, or September. But if you have no choice but to travel during the peak European vacation period, July is a good compromise: the rainy season is on pause, and numerous events will make your stay memorable!
Where and when to go based on the weather?
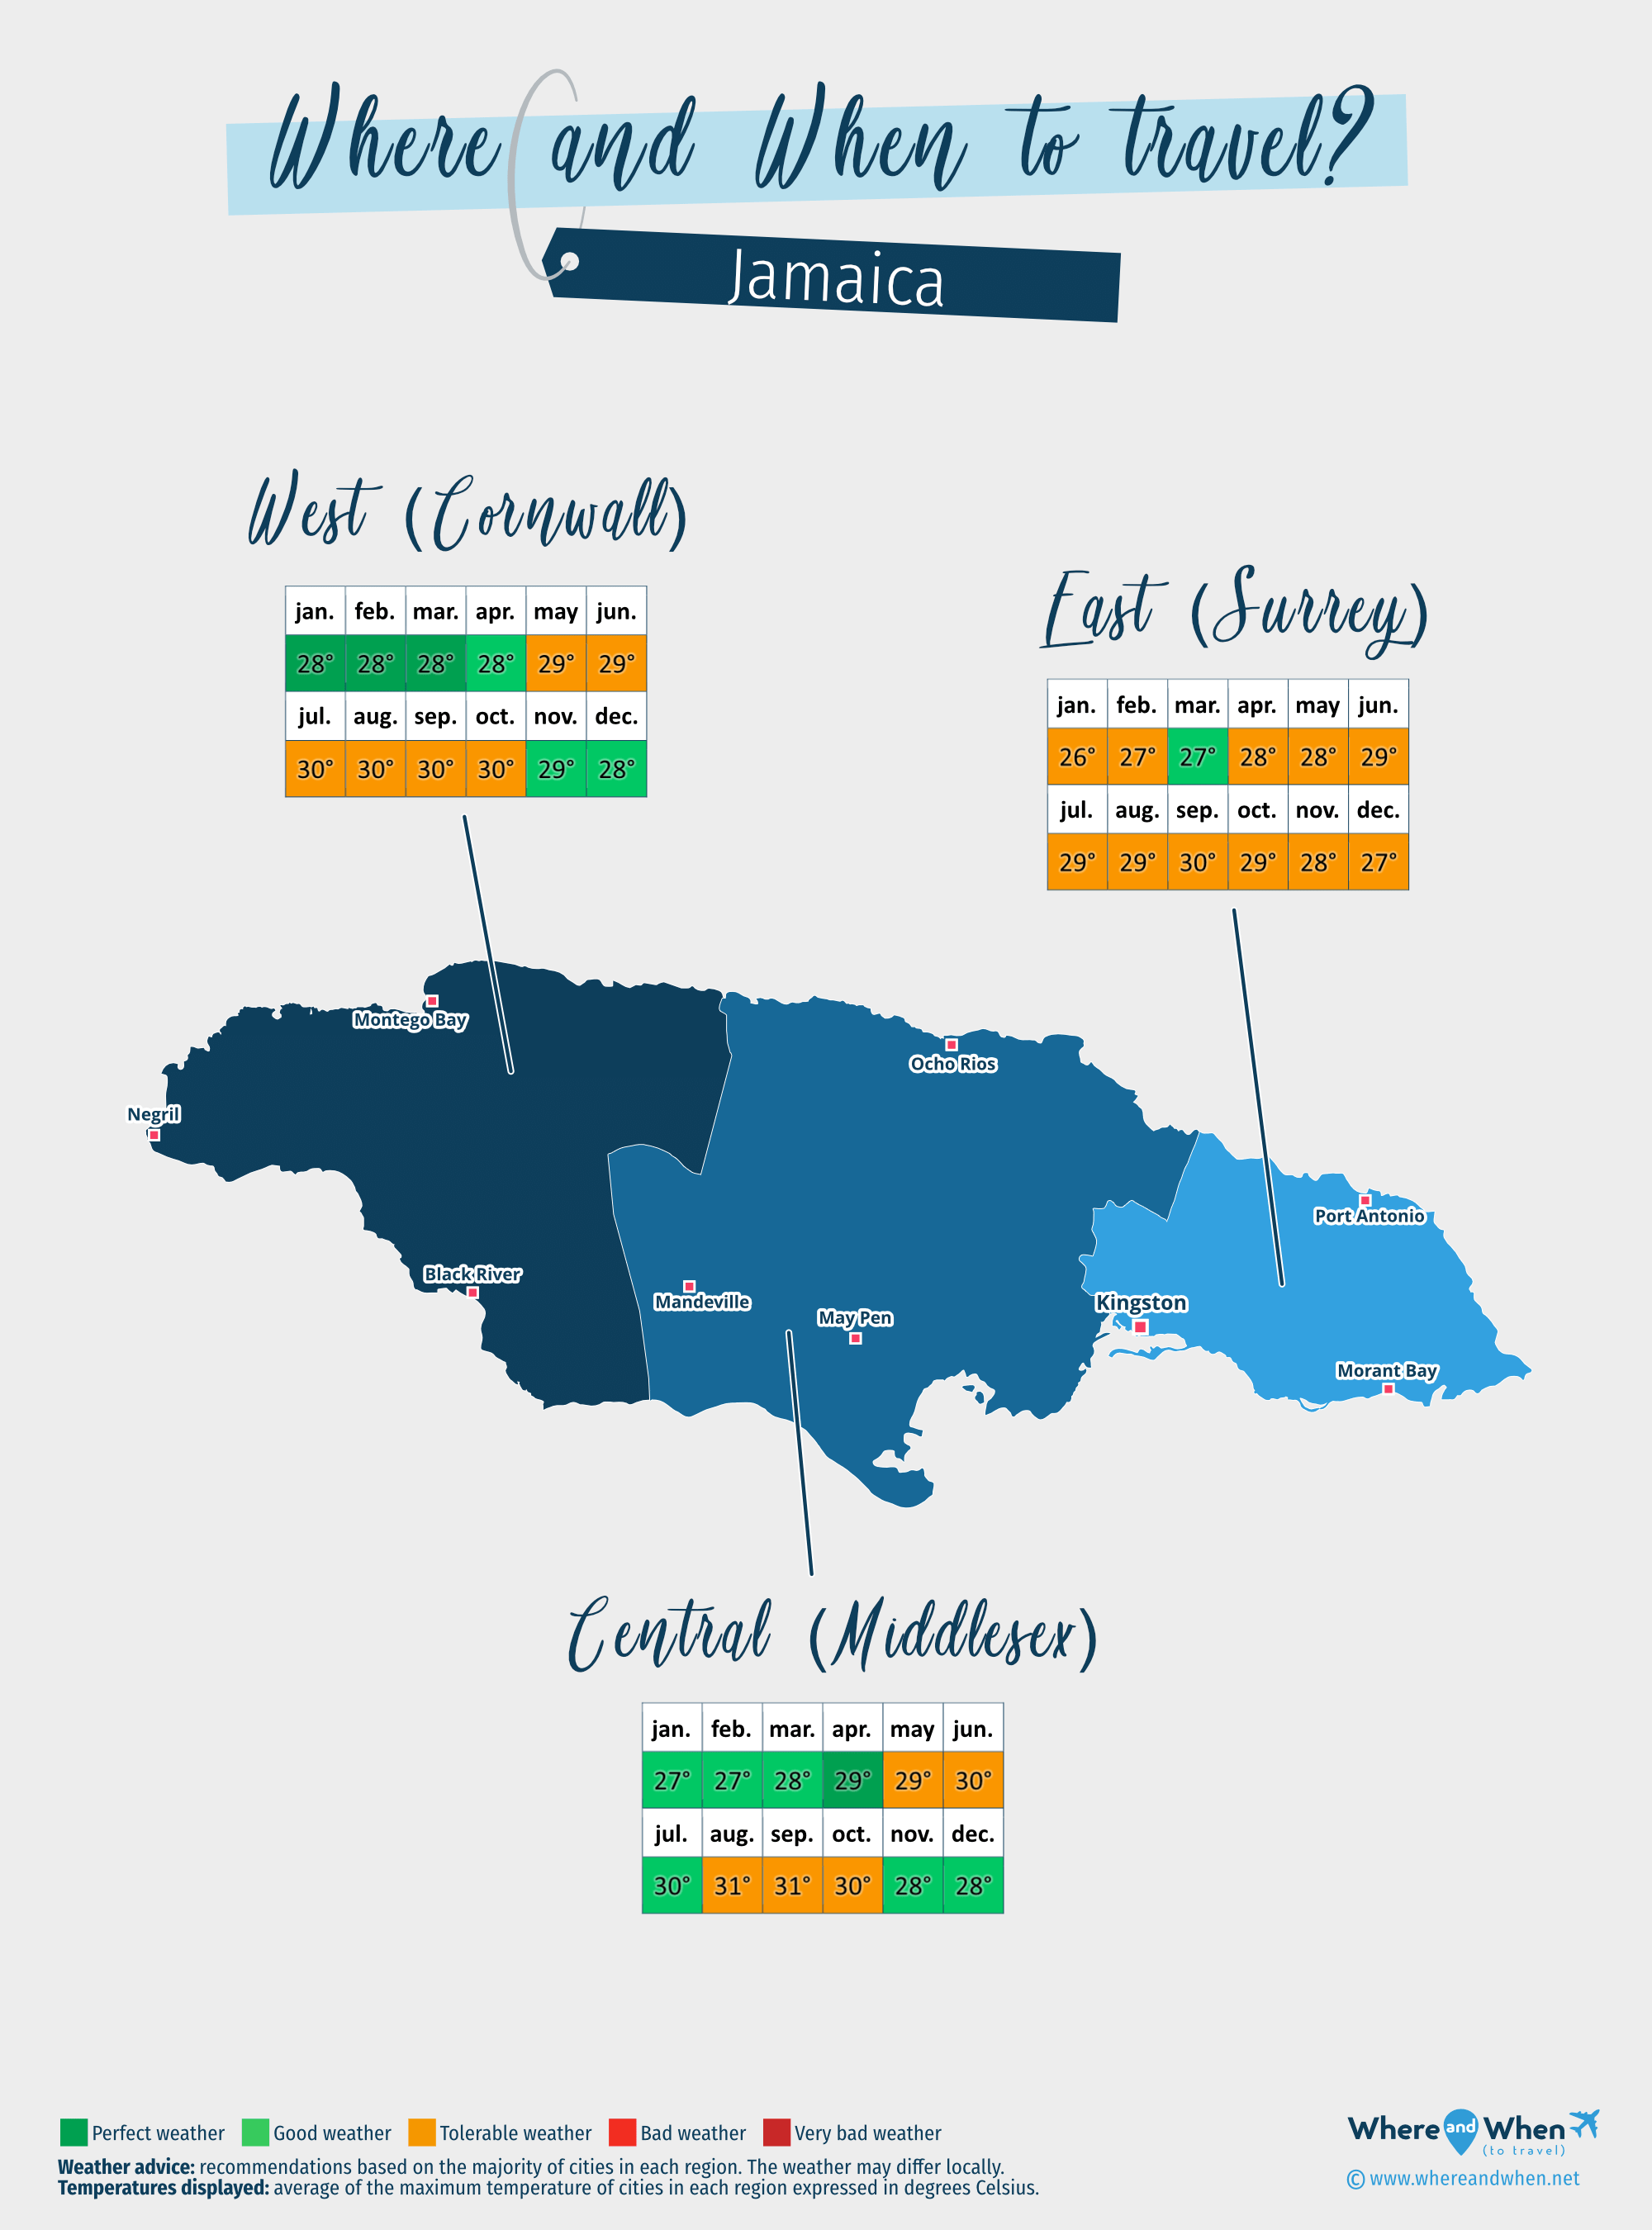
Central (Middlesex)
Ocho Rios, Mandeville, May Pen...
East (Surrey)
Kingston, Port Antonio, Morant Bay...
West (Cornwall)
Montego Bay, Negril, Black River...
To get all the information about the climate and weather in Jamaica for a specific month, click on the corresponding link below:
Jamaica in january Jamaica in february Jamaica in march Jamaica in april Jamaica in may Jamaica in june Jamaica in july Jamaica in august Jamaica in september Jamaica in october Jamaica in november Jamaica in december
Best time to travel to Jamaica by cities


Climate and Weather in Jamaica
Jamaica's climate is of the tropical savanna type with a dry winter. In summary, temperatures vary little throughout the year, providing pleasant warmth, unlike humidity levels which fluctuate depending on the months.
The weather in Jamaica is greatly influenced by the trade winds, typical winds of tropical regions that give rise to two distinct seasons, although not very pronounced:
- A dry season that starts in early November and ends in late April. During this period, humidity levels are lower, but rain is still present in the form of short showers, especially in the evenings and nights in the eastern part of the island. The thermometer shows averages between 27 and 28°C (83°F) , both in the water and in the air. These temperatures are moderated by the north winds, the "nortes," which can blow strongly.
- A rainy season that runs from May to November, with a noticeable lull in June and July. The air is then heavy with humidity and can be stifling, as the trade winds are almost absent. Rain falls regularly, but very rarely continuously throughout the day. Most often, it consists of intense and short showers, allowing you to fully enjoy your stay as soon as the sun reappears. It is between mid-August and October that hurricanes, sometimes violent, can occur, but less so than in other islands in the region, such as the Dominican Republic or Puerto Rico. In terms of temperatures, highs range from 29 to 32°C (90°F) , with September being the hottest month.
It is also worth noting that rainfall is higher in the northeast of the island, and even more so in the Blue Mountains. In contrast, the South and the northwest coast, towards Montego Bay, are much drier. Furthermore, the climate is cooler in the mountains, with a difference of nearly 10°C (50°F) compared to the coast.

Climate in the West (Cornwall)
Between November and April is the ideal season to explore the west of Jamaica, whether towards Montego Bay or in the Negril region. The temperature ranges between 27 and 29°C (85°F) and rainfall is quite rare. January is the "coolest" month. During the rainy season, from May to October, August is the rainiest month.
To the south of this region, towards Black River, the weather is different: hotter and more humid. It rains a lot throughout the year, with a significant peak in May and from August to October. The thermometer fluctuates between 29 and 32°C (90°F) , with September being the hottest month.
Climate in the Center (Middlesex)
The same trend is found in the center of Jamaica: the weather in the northeast is much drier than in Mandeville or May Pen in the south.
In Ocho Rios, the risk of precipitation is around 11% in January and 36% in October, while in Mandeville it is 23% and 68% during the same periods.
As elsewhere on the island, there is a small temperature range. Expect temperatures between 27 and 30°C (86°F) , with daily averages around 32°C (90°F) during the rainy season towards Spanish Town or Old Harbour.
Climate in the East (Surrey)
This region has a unique climate compared to the rest of Jamaica, and the only truly ideal period to visit is in March, when it rains significantly less. The rest of the time, the weather is often humid, especially in August and October.
In the capital, Kingston, located on the south coast, it rains the most during the rainy season. Conversely, in Port Antonio or Morant Bay, showers are most frequent during the dry season, from November to May. However, as mentioned earlier, the sky clears up quickly.
Temperatures and rainfall in Jamaica
On these 3 graphs, we present the evolution of temperatures of Jamaica and month-by-month rainfall for the cities of Kingston, Montego Bay, Negril, Ocho Rios and Black River, as well as the month-by-month sea temperature for coastal cities.

Peak visitor numbers and tourist seasons in Jamaica
Find out when Jamaica has its high tourist season (the period when the influx of tourists is highest) and off-peak tourist season using our data and figures.
Tourist seasons in Jamaica
The months with low numbers of tourists are: February, March, April, May, June, July, September, October and November. The number of visitors to Jamaica is high in: January, August and December.
- Very low season in Jamaica: May, June, September and October.
- Low season in Jamaica: February, March, April, July and November.
- High season in Jamaica: January and August.
- Peak season in Jamaica: December.
Figure: Visitor index for Jamaica month by month
Average price for flights to Jamaica
A return flight between London and Montego Bay is generally cheaper if you go in november ($ 962 on average): this is the best time for travellers on a tight budget. In contrast, you may end up paying $ 503 more for your airline ticket to Montego Bay if you go in august.
Where to go in Jamaica?
This table allows you to see the maximum temperature for each city and our opinion on the weather month by month (see colour legend below the table).
| Cities | jan. | feb. | mar. | apr. | may | jun. | jul. | aug. | sep. | oct. | nov. | dec. |
| Kingston | 81°F | 81°F | 83°F | 85°F | 86°F | 86°F | 88°F | 88°F | 90°F | 86°F | 85°F | 83°F |
| Montego Bay | 81°F | 83°F | 83°F | 83°F | 85°F | 86°F | 86°F | 86°F | 86°F | 86°F | 85°F | 83°F |
| Negril | 83°F | 83°F | 83°F | 83°F | 85°F | 86°F | 86°F | 86°F | 86°F | 86°F | 85°F | 83°F |
| Ocho Rios | 81°F | 81°F | 81°F | 83°F | 85°F | 86°F | 86°F | 86°F | 88°F | 86°F | 85°F | 83°F |
| Black River | 86°F | 86°F | 85°F | 86°F | 85°F | 85°F | 86°F | 88°F | 90°F | 88°F | 88°F | 86°F |
| Mandeville | 86°F | 86°F | 85°F | 86°F | 85°F | 85°F | 86°F | 88°F | 90°F | 88°F | 88°F | 86°F |
| May Pen | 81°F | 81°F | 83°F | 86°F | 88°F | 88°F | 90°F | 88°F | 88°F | 85°F | 83°F | 81°F |
| Morant Bay | 81°F | 81°F | 81°F | 81°F | 83°F | 85°F | 85°F | 85°F | 85°F | 85°F | 83°F | 81°F |
| Port Antonio | 81°F | 81°F | 81°F | 83°F | 83°F | 85°F | 86°F | 86°F | 86°F | 85°F | 83°F | 83°F |
| Ewarton | 83°F | 85°F | 85°F | 86°F | 88°F | 88°F | 90°F | 90°F | 90°F | 88°F | 86°F | 85°F |
| Port Morant | 81°F | 81°F | 81°F | 81°F | 83°F | 85°F | 85°F | 85°F | 85°F | 85°F | 83°F | 81°F |
| Old Harbour | 81°F | 81°F | 83°F | 86°F | 88°F | 88°F | 90°F | 88°F | 88°F | 85°F | 83°F | 81°F |
| Port Maria | 81°F | 81°F | 81°F | 83°F | 85°F | 86°F | 86°F | 86°F | 88°F | 86°F | 85°F | 83°F |
| Runaway Bay | 81°F | 81°F | 81°F | 83°F | 85°F | 86°F | 86°F | 86°F | 88°F | 86°F | 85°F | 83°F |
| Spanish Town | 83°F | 85°F | 85°F | 86°F | 88°F | 88°F | 90°F | 90°F | 90°F | 88°F | 86°F | 85°F |
Legend:
perfect weather
good weather
tolerable weather
bad weather
About Jamaica
What can I do in Jamaica?
Beaches / swimming
Nature and countryside
Culture and heritage
Sports
Family travel
Crafts / shopping
Gastronomy
Nightlife
Is this weather information for Jamaica reliable?
Climate data for Jamaica has been gathered every day since January 2009. The analysis of these meteorological data for Jamaica allows us to determine the average for each month in Kingston, Montego Bay, Negril, Ocho Rios, Black River, Mandeville, May Pen, Morant Bay, and 7 other cities.
So yes: this data is reliable except in cases of temporary climate disruption in the region.