Best time to go to Egilsstaðir Average weather of Egilsstaðir, Iceland
When is the best time to go to Egilsstaðir?
When is the best time to go to Egilsstaðir? Here's some information to help you in your decision:
- The best months in Egilsstaðir are July and August
- The coldest months are January, March and December
- The rainiest months are January, February, October, November and December
Annual weather in Egilsstaðir
For full information about the climate and weather in Egilsstaðir a specific month, click on the corresponding line below:
| Month | Our opinion | ||||
|---|---|---|---|---|---|
| January | 22°F/32°F | very bad weather | Egilsstaðir in january | ||
| February | 23°F/34°F | very bad weather | Egilsstaðir in february | ||
| March | 22°F/34°F | very bad weather | Egilsstaðir in march | ||
| April | 27°F/40°F | very bad weather | Egilsstaðir in april | ||
| May | 36°F/45°F | very bad weather | Egilsstaðir in may | ||
| June | 47°F/54°F | bad weather | Egilsstaðir in june | ||
| July | 49°F/58°F | tolerable weather | Egilsstaðir in july | ||
| August | 45°F/56°F | tolerable weather | Egilsstaðir in august | ||
| September | 38°F/50°F | very bad weather | Egilsstaðir in september | ||
| October | 32°F/41°F | very bad weather | Egilsstaðir in october | ||
| November | 25°F/34°F | very bad weather | Egilsstaðir in november | ||
| December | 22°F/31°F | very bad weather | Egilsstaðir in december |


Weather and climate in Egilsstaðir
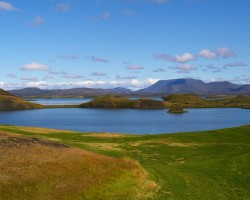
Egilsstaðir enjoys a tundra climate in accordance with the Köppen-Geiger classification. The yearly average maximum temperature in Egilsstaðir is 43°F (ranging from 31°F in december to 58°F in july). Annual rainfall is 86.1in, with a minimum of 3.6in in june and a maximum of 11in in december.
- Between the months of january and may the climate is very unfavorable. The record temperature this month is 68°F and, in may, 9 days of rain are expected.
- In the month of june the climate is bad. In average, on the morning it is 47°F and, in june, 6 days of rain are expected.
- Between july and august the climate is okay. By early evening, the temperature averages 54°F and it rains about 23% of the time in august.
- Between september and december the climate is very unfavorable. At lunchtime, it's 29°F in average and it rains about 43% of the time in december.
Charts: temperature and rainfall in Egilsstaðir
In the charts below, you can see the following seasonal norms for the city of Egilsstaðir: the minimum and maximum outdoor temperature, the risk and amount of monthly rainfall, daily average sunshine, and relative humidity for each month of the year.
Outside temperature
Precipitation (rainfall)
Daily sunshine hours
Humidity
Other cities and places near Egilsstaðir


Chargement en cours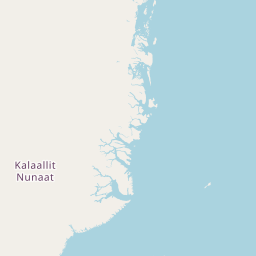
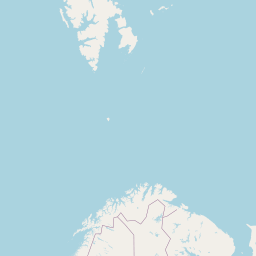


Leaflet | © OpenStreetMap contributors
Legend:
 Egilsstaðir
 other locations
Egilsstaðir
other locations