Best time to go to Carrarang Average weather of Carrarang, Australia
When is the best time to go to Carrarang?
When is the best time to go to Carrarang? Here's some information to help you in your decision:
- The weather is good all year round in Carrarang
- On average, the warmest months are January, February, March, April and December
- November is the driest month
- June is the rainiest month
Annual weather in Carrarang
To get all the information about the climate and weather in Carrarang for a specific month, scroll down below the table and choose a month from the tabs.
| Month | Our opinion | |||
|---|---|---|---|---|
| January | 77°F/83°F | perfect weather | ||
| February | 79°F/85°F | perfect weather | ||
| March | 79°F/85°F | perfect weather | ||
| April | 76°F/81°F | perfect weather | ||
| May | 72°F/77°F | perfect weather | ||
| June | 68°F/74°F | perfect weather | ||
| July | 67°F/70°F | perfect weather | ||
| August | 67°F/70°F | perfect weather | ||
| September | 67°F/72°F | perfect weather | ||
| October | 68°F/74°F | perfect weather | ||
| November | 72°F/76°F | perfect weather | ||
| December | 76°F/79°F | perfect weather |

Weather detail month by month in Carrarang
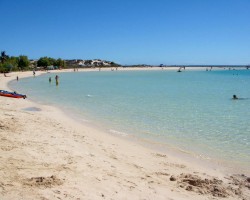
Weather and climate in Carrarang
Carrarang enjoys a steppe (or semi-arid) climate in accordance with the Köppen-Geiger classification. The yearly average maximum temperature in Carrarang is 77°F (ranging from 70°F in july to 85°F in february). Annual rainfall is 13.5in, with a minimum of 0.4in in november and a maximum of 3.3in in june.
- From january to may the climate is very good. At lunchtime, it's 76°F in average and it rains about 5% of the time in may.
- In the month of june the climate is favorable. By early evening, the temperature averages 72°F and it rains about 12% of the time in june.
- Between the months of july and december the climate is perfect. The record temperature this month is 95°F and it rains about 1in each month.
Charts: temperature and rainfall in Carrarang
In the charts below, you can see the following seasonal norms for the city of Carrarang: the minimum and maximum outdoor temperature, the risk and amount of monthly rainfall, daily average sunshine, and relative humidity for each month of the year.
Outside temperature
Precipitation (rainfall)
Daily sunshine hours
Humidity
Other cities and places near Carrarang


Chargement en cours
Legend:
 Carrarang
 other locations
Carrarang
other locations