Best time to go to Kumluca Average weather of Kumluca, Turkey
When is the best time to go to Kumluca?
When is the best time to go to Kumluca? Here's some information to help you in your decision:
- The best months for good weather in Kumluca are March, April, May, June, July, August, September, October and November
- On average, the warmest months are July and August
- Kumluca has dry periods in July and August
- January is the coldest month of the year
- The rainiest months are January and December
- The best months for swimming are July, August and September
Annual weather in Kumluca
To get all the information about the climate and weather in Kumluca for a specific month, scroll down below the table and choose a month from the tabs.
| Month | Our opinion | |||
|---|---|---|---|---|
| January | 49°F/56°F | tolerable weather | ||
| February | 50°F/58°F | tolerable weather | ||
| March | 56°F/61°F | good weather | ||
| April | 63°F/68°F | good weather | ||
| May | 70°F/77°F | perfect weather | ||
| June | 77°F/85°F | perfect weather | ||
| July | 85°F/92°F | perfect weather | ||
| August | 85°F/92°F | perfect weather | ||
| September | 77°F/85°F | perfect weather | ||
| October | 68°F/76°F | perfect weather | ||
| November | 59°F/67°F | good weather | ||
| December | 50°F/59°F | tolerable weather |

Weather detail month by month in Kumluca

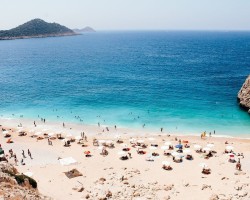
Weather and climate in Kumluca
Kumluca enjoys a hot-summer Mediterranean climate in accordance with the Köppen-Geiger classification. The yearly average maximum temperature in Kumluca is 72°F (ranging from 56°F in january to 92°F in august). Annual rainfall is 46.1in, with a minimum of 0.2in in july and a maximum of 10.7in in january.
- Between the months of january and february the climate is passable, but still OK. In average, on the morning it is 50°F.
- Between march and may the climate is good. At lunchtime, it's 76°F in average.
- Between the months of june and october the climate is perfect. By early evening, the temperature averages 68°F and you can expect to have 3.3in of rainfall/month during this period.
- In november the climate is favorable. In average, on the morning it is 59°F and it rains about 14% of the time in november.
- In the month of december the climate is passable, but still OK. It is for example 59°F as maximum temperature in december and it rains about 10.4in each month.
Charts: temperature and rainfall in Kumluca
In the charts below, you can see the following seasonal norms for the city of Kumluca: the minimum and maximum outdoor temperature, the risk and amount of monthly rainfall, daily average sunshine, sea temperature, and relative humidity for each month of the year.
Outside temperature
Precipitation (rainfall)
Daily sunshine hours
Sea temperature
Humidity
Peak visitor numbers and tourist seasons in Kumluca
Find out when Kumluca has its high tourist season (the period when the influx of tourists is highest) and off-peak tourist season using our data and figures.
Tourist seasons in Kumluca
- Very low season in Kumluca
The months with the lowest number of tourists are: January, February, March, November and December. - Low season in Kumluca
The months with low numbers of tourists are: April, June and October. - High season in Kumluca
The number of visitors to Kumluca is high in: May and September. - Peak season in Kumluca
The largest number of tourists visiting Kumluca is during: July and August.
Figure: Visitor index for Kumluca month by month
Other cities and places near Kumluca


Chargement en cours


Leaflet | © OpenStreetMap contributors
Legend:
 Kumluca
 other locations
Kumluca
other locations