Best time to go to Tokyo Average weather of Tokyo, Japan
When is the best time to go to Tokyo?
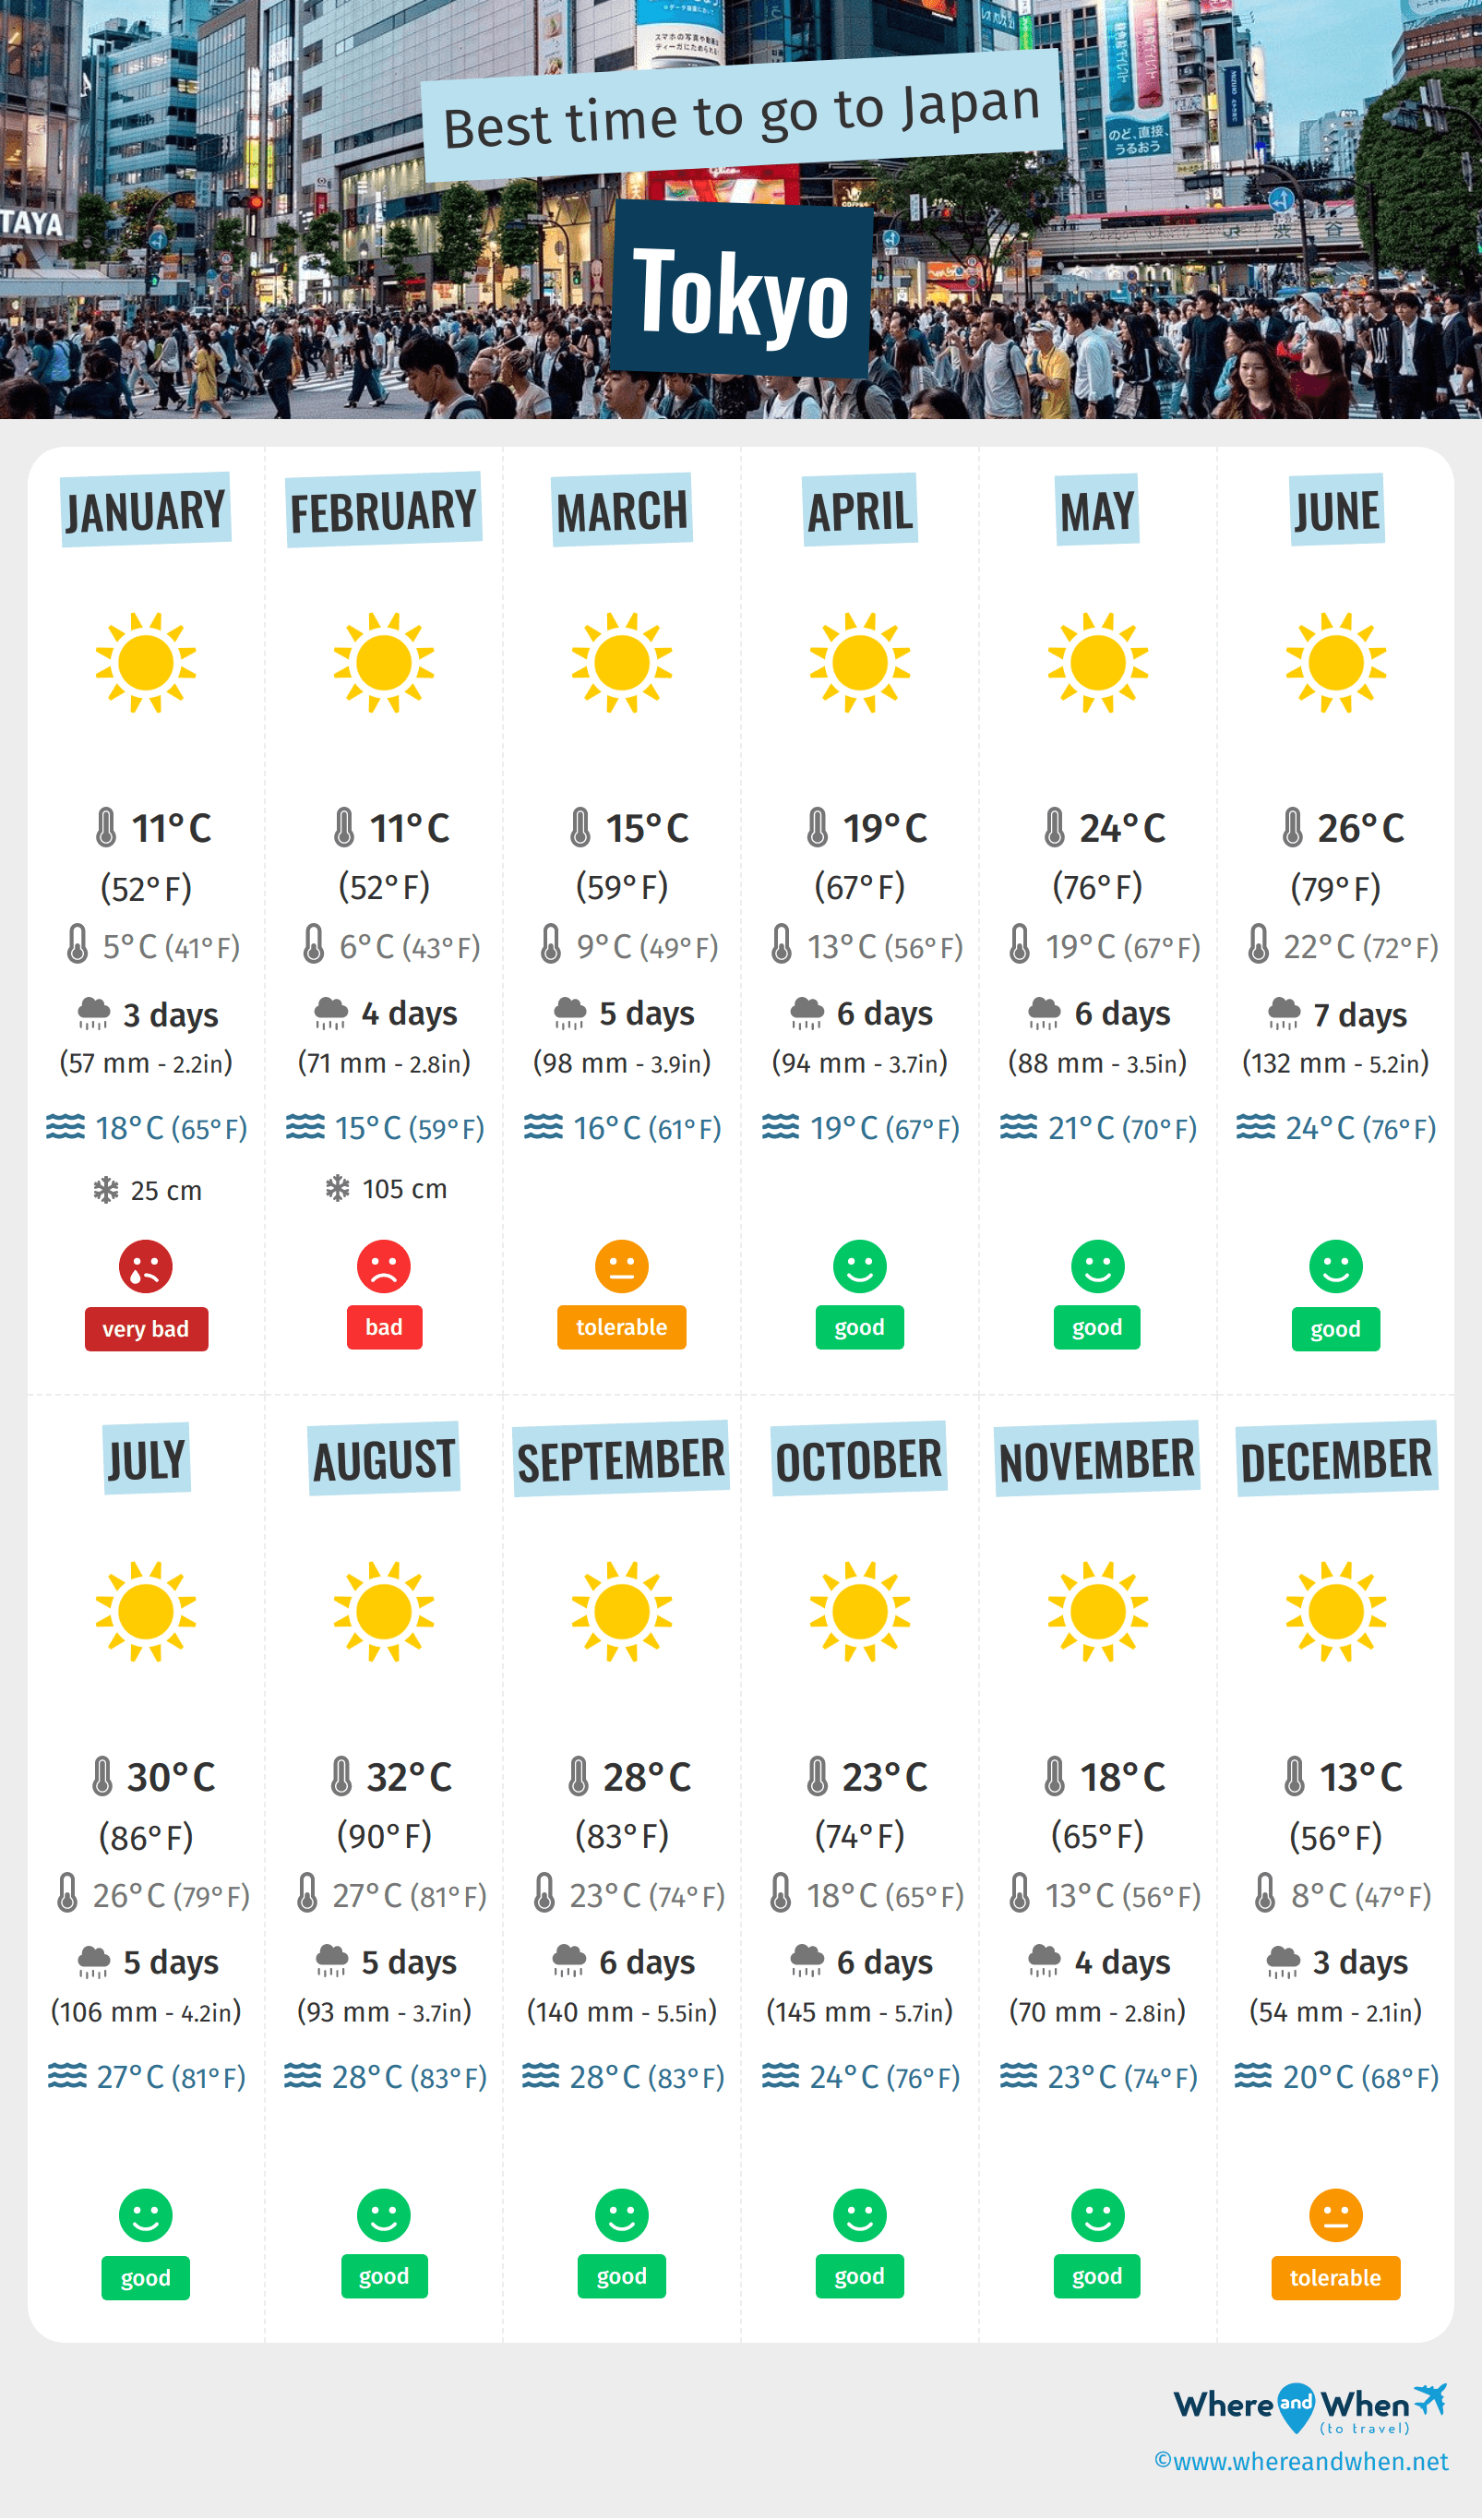
Tokyo experiences pleasant weather conditions from April to November. However, the best time to visit Tokyo is definitely in early April during the cherry blossom season and throughout the summer.
Indeed, from June to September, the temperatures are very mild in this region of Japan, ranging from 23 to 31°C (88°F) on average. During July and August, the heat is omnipresent as it is rare for the mercury to drop below 27°C (81°F) .
Nevertheless, Tokyo's summer climate is dry and sunny, allowing for enjoyable days of sightseeing.
Of course, this period coincides with a high tourist influx: many vacationers are eager to explore Tokyo's famous tourist sites during the peak season. Additionally, several cultural events take place in the summer.
If you are wondering when to visit Tokyo to see cherry blossoms in bloom, you will need to be careful in planning your trip. While the cherry blossom season in Japan is estimated to be from March to May, the window is narrower in Tokyo. It is between late March and early April.
Furthermore, October and November are a good option for visiting Tokyo in a quieter atmosphere. You will encounter fewer tourists and pleasant weather conditions.
Lastly, if you are not afraid of facing the cold during your trip, visiting Tokyo in winter can be a good idea. The city has a special charm during this season.
So, when is the best time to go to Tokyo? Here's some more information to help you in your decision:
- The best months for good weather in Tokyo are April, May, June, July, August, September, October and November
- On average, the warmest months are July and August
- January is the coldest month of the year
- The rainiest months are June, September and October
- The best months for swimming are July, August, September and October
Annual weather in Tokyo
Weather details in Tokyo month by month
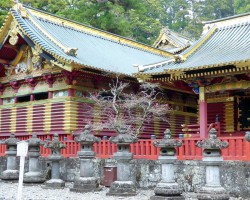
Weather and climate in Tokyo
Tokyo, the capital of Japan, is one of the most visited cities in Asia. To fully enjoy your trip, it is best to go during the months when the weather conditions are most favorable.
Keep in mind that Tokyo has a humid subtropical climate. Therefore, between April and November, the weather in Tokyo is pleasant, but be prepared for occasional rainy episodes. But what about winter?
Here are more details on Tokyo's climate season by season to help you plan your trip.
Spring Climate in Tokyo
Due to its geographical location, Tokyo enjoys beautiful weather conditions in spring.
Spring arrives earlier in Tokyo than on the island of Hokkaido. By March, the atmosphere becomes milder and trees start to bloom. In April, temperatures range from 15 to 20°C (68°F) , and they are above 20°C (68°F) from May.
However, rain can occur at any time during this period. The climate in Tokyo is always quite humid, although rainfall is generally in small amounts.
Summer Climate in Tokyo
From June to September, the climate in Tokyo is very pleasant. The sun is shining, and temperatures range from 25 to 30°C (86°F) .
In July and August, the heat can be intense, but the air is less heavy than in Osaka or Kyoto. Indeed, the humidity level is lower in Tokyo, making the air a bit cooler. This period is one of the most favorable to explore the Japanese capital and its cultural heritage.
However, it is advisable to bring an umbrella when going out. Like in any season, light showers can occur in Tokyo.
Finally, while the typhoon season in Japan runs from May to October, typhoons are more common in August and September. Therefore, be aware that Tokyo is not immune to such events if you travel at the end of summer.
Autumn Climate in Tokyo
The autumn climate in Tokyo is characterized by sunny weather and mild temperatures.
Autumn in Tokyo is a beautiful extension of summer. In September, it's around 25°C (77°F) , while it's about 20°C (68°F) in October and close to 15°C (59°F) in November.
However, precipitation tends to intensify in September and October, with about 7 rainy days per month. If you travel during this rainy season in Japan, it's advisable to bring waterproof clothing.
Winter Climate in Tokyo
Winter on the island of Honshu generally lasts from December to March. During this period, temperatures can drop below 10°C (50°F) . However, the winter weather in Tokyo is much milder than in neighboring cities like Sendai. Precipitation is very low, and the weather remains relatively sunny.
In terms of temperature, Tokyo enjoys mild winters. It's around 10°C (50°F) in December and between 6 and 10°C (50°F) in January and February.
Considering that it's between -5 and -10°C in Sapporo during the same period, the choice is quickly made to plan your winter vacation in Japan.

Charts: temperature and rainfall in Tokyo
In the charts below, you can see the following seasonal norms for the city of Tokyo: the minimum and maximum outdoor temperature, the risk and amount of monthly rainfall, daily average sunshine, sea temperature, and relative humidity for each month of the year.
Outside temperature
Precipitation (rainfall)
Daily sunshine hours
Sea temperature
Humidity
Peak visitor numbers and tourist seasons in Tokyo
Find out when Tokyo has its high tourist season (the period when the influx of tourists is highest) and off-peak tourist season using our data and figures.
Tourist seasons in Tokyo
- Very low season in Tokyo
The months with the lowest number of tourists are: January. - Low season in Tokyo
The months with low numbers of tourists are: February and June. - High season in Tokyo
The number of visitors to Tokyo is high in: March, May, July, August and September. - Peak season in Tokyo
The largest number of tourists visiting Tokyo is during: April, October, November and December.
Figure: Visitor index for Tokyo month by month
Best time for low prices in Tokyo
Average prices of hotels in Tokyo month by month
Generally, January is the month with the lowest hotel prices in Tokyo. So this is a great time to save on your holiday! In contrast, March is statistically the most expensive month of the year for hotels.

Find the best price for your hotel room
Average price for flights to Tokyo
A return flight between London and Tokyo is generally cheaper if you go in june ($ 1129 on average): this is the best time for travellers on a tight budget. In contrast, you may end up paying $ 565 more for your airline ticket to Tokyo if you go in august.
Find the best price for your flight
Average price of hiring a car in Tokyo
On average, it costs $ 64 per day to hire a car in Tokyo. This price varies by $ 19 depending on the month. In march, hiring a car costs an average of $ 54 per 24 hours, so this is the best time to save money! In contrast, the average price in august is $ 72.
Other cities and places near Tokyo


 Tokyo
Tokyo
 other locations