Best time to go to Cayo Cantiles Average weather of Cayo Cantiles, Cuba
When is the best time to go to Cayo Cantiles?
When is the best time to go to Cayo Cantiles? Here's some information to help you in your decision:
- The best months for good weather in Cayo Cantiles are January, February, March, April, May, July, November and December
- On average, the warmest months are April, May, June, July, August, September and October
- The rainiest months are September and October
Annual weather in Cayo Cantiles
To get all the information about the climate and weather in Cayo Cantiles for a specific month, scroll down below the table and choose a month from the tabs.
| Month | Our opinion | |||
|---|---|---|---|---|
| January | 74°F/79°F | perfect weather | ||
| February | 76°F/79°F | perfect weather | ||
| March | 76°F/81°F | perfect weather | ||
| April | 79°F/85°F | perfect weather | ||
| May | 81°F/85°F | good weather | ||
| June | 83°F/86°F | tolerable weather | ||
| July | 85°F/88°F | good weather | ||
| August | 85°F/88°F | tolerable weather | ||
| September | 83°F/88°F | tolerable weather | ||
| October | 81°F/86°F | tolerable weather | ||
| November | 77°F/83°F | good weather | ||
| December | 77°F/81°F | perfect weather |

Weather detail month by month in Cayo Cantiles
Weather and climate in Cayo Cantiles
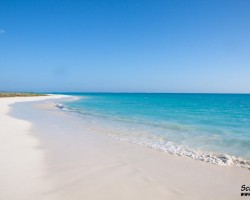
Cayo Cantiles enjoys a tropical savanna climate (with dry winter) in accordance with the Köppen-Geiger classification. The yearly average maximum temperature in Cayo Cantiles is 85°F (ranging from 79°F in january to 88°F in august). Annual rainfall is 61.3in, with a minimum of 1.4in in march and a maximum of 10.2in in october.
- In the month of january the climate is good. the thermometer goes up to 79°F°C and it rains about 2.5in each month.
- Between february and april the climate is perfect. The record temperature this month is 94°F and, in april, 3 days of rain are expected.
- Between the months of may and june the climate is good. the thermometer goes up to 86°F°C and it rains about 7.2in each month.
- Between the months of july and september the climate is just OK. In average, on the morning it is 83°F and it rains in september about 8.6in.
- Between october and december the climate is beautiful. The record temperature this month is 85°F and it rains in december about 2.8in.

Charts: temperature and rainfall in Cayo Cantiles
In the charts below, you can see the following seasonal norms for the city of Cayo Cantiles: the minimum and maximum outdoor temperature, the risk and amount of monthly rainfall, daily average sunshine, and relative humidity for each month of the year.
Outside temperature
Precipitation (rainfall)
Daily sunshine hours
Humidity
Other cities and places near Cayo Cantiles


Chargement en cours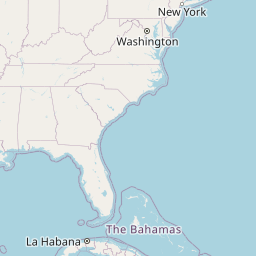
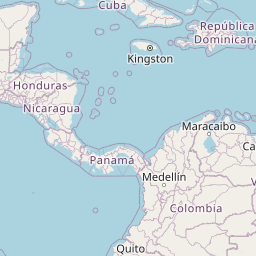
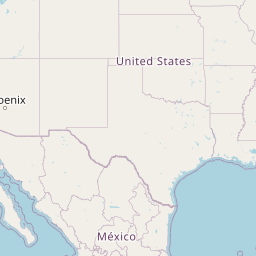


Leaflet | © OpenStreetMap contributors
Legend:
 Cayo Cantiles
 other locations
Cayo Cantiles
other locations