Best time to go to Da Nang Average weather of Da Nang, Vietnam
When is the best time to go to Da Nang?
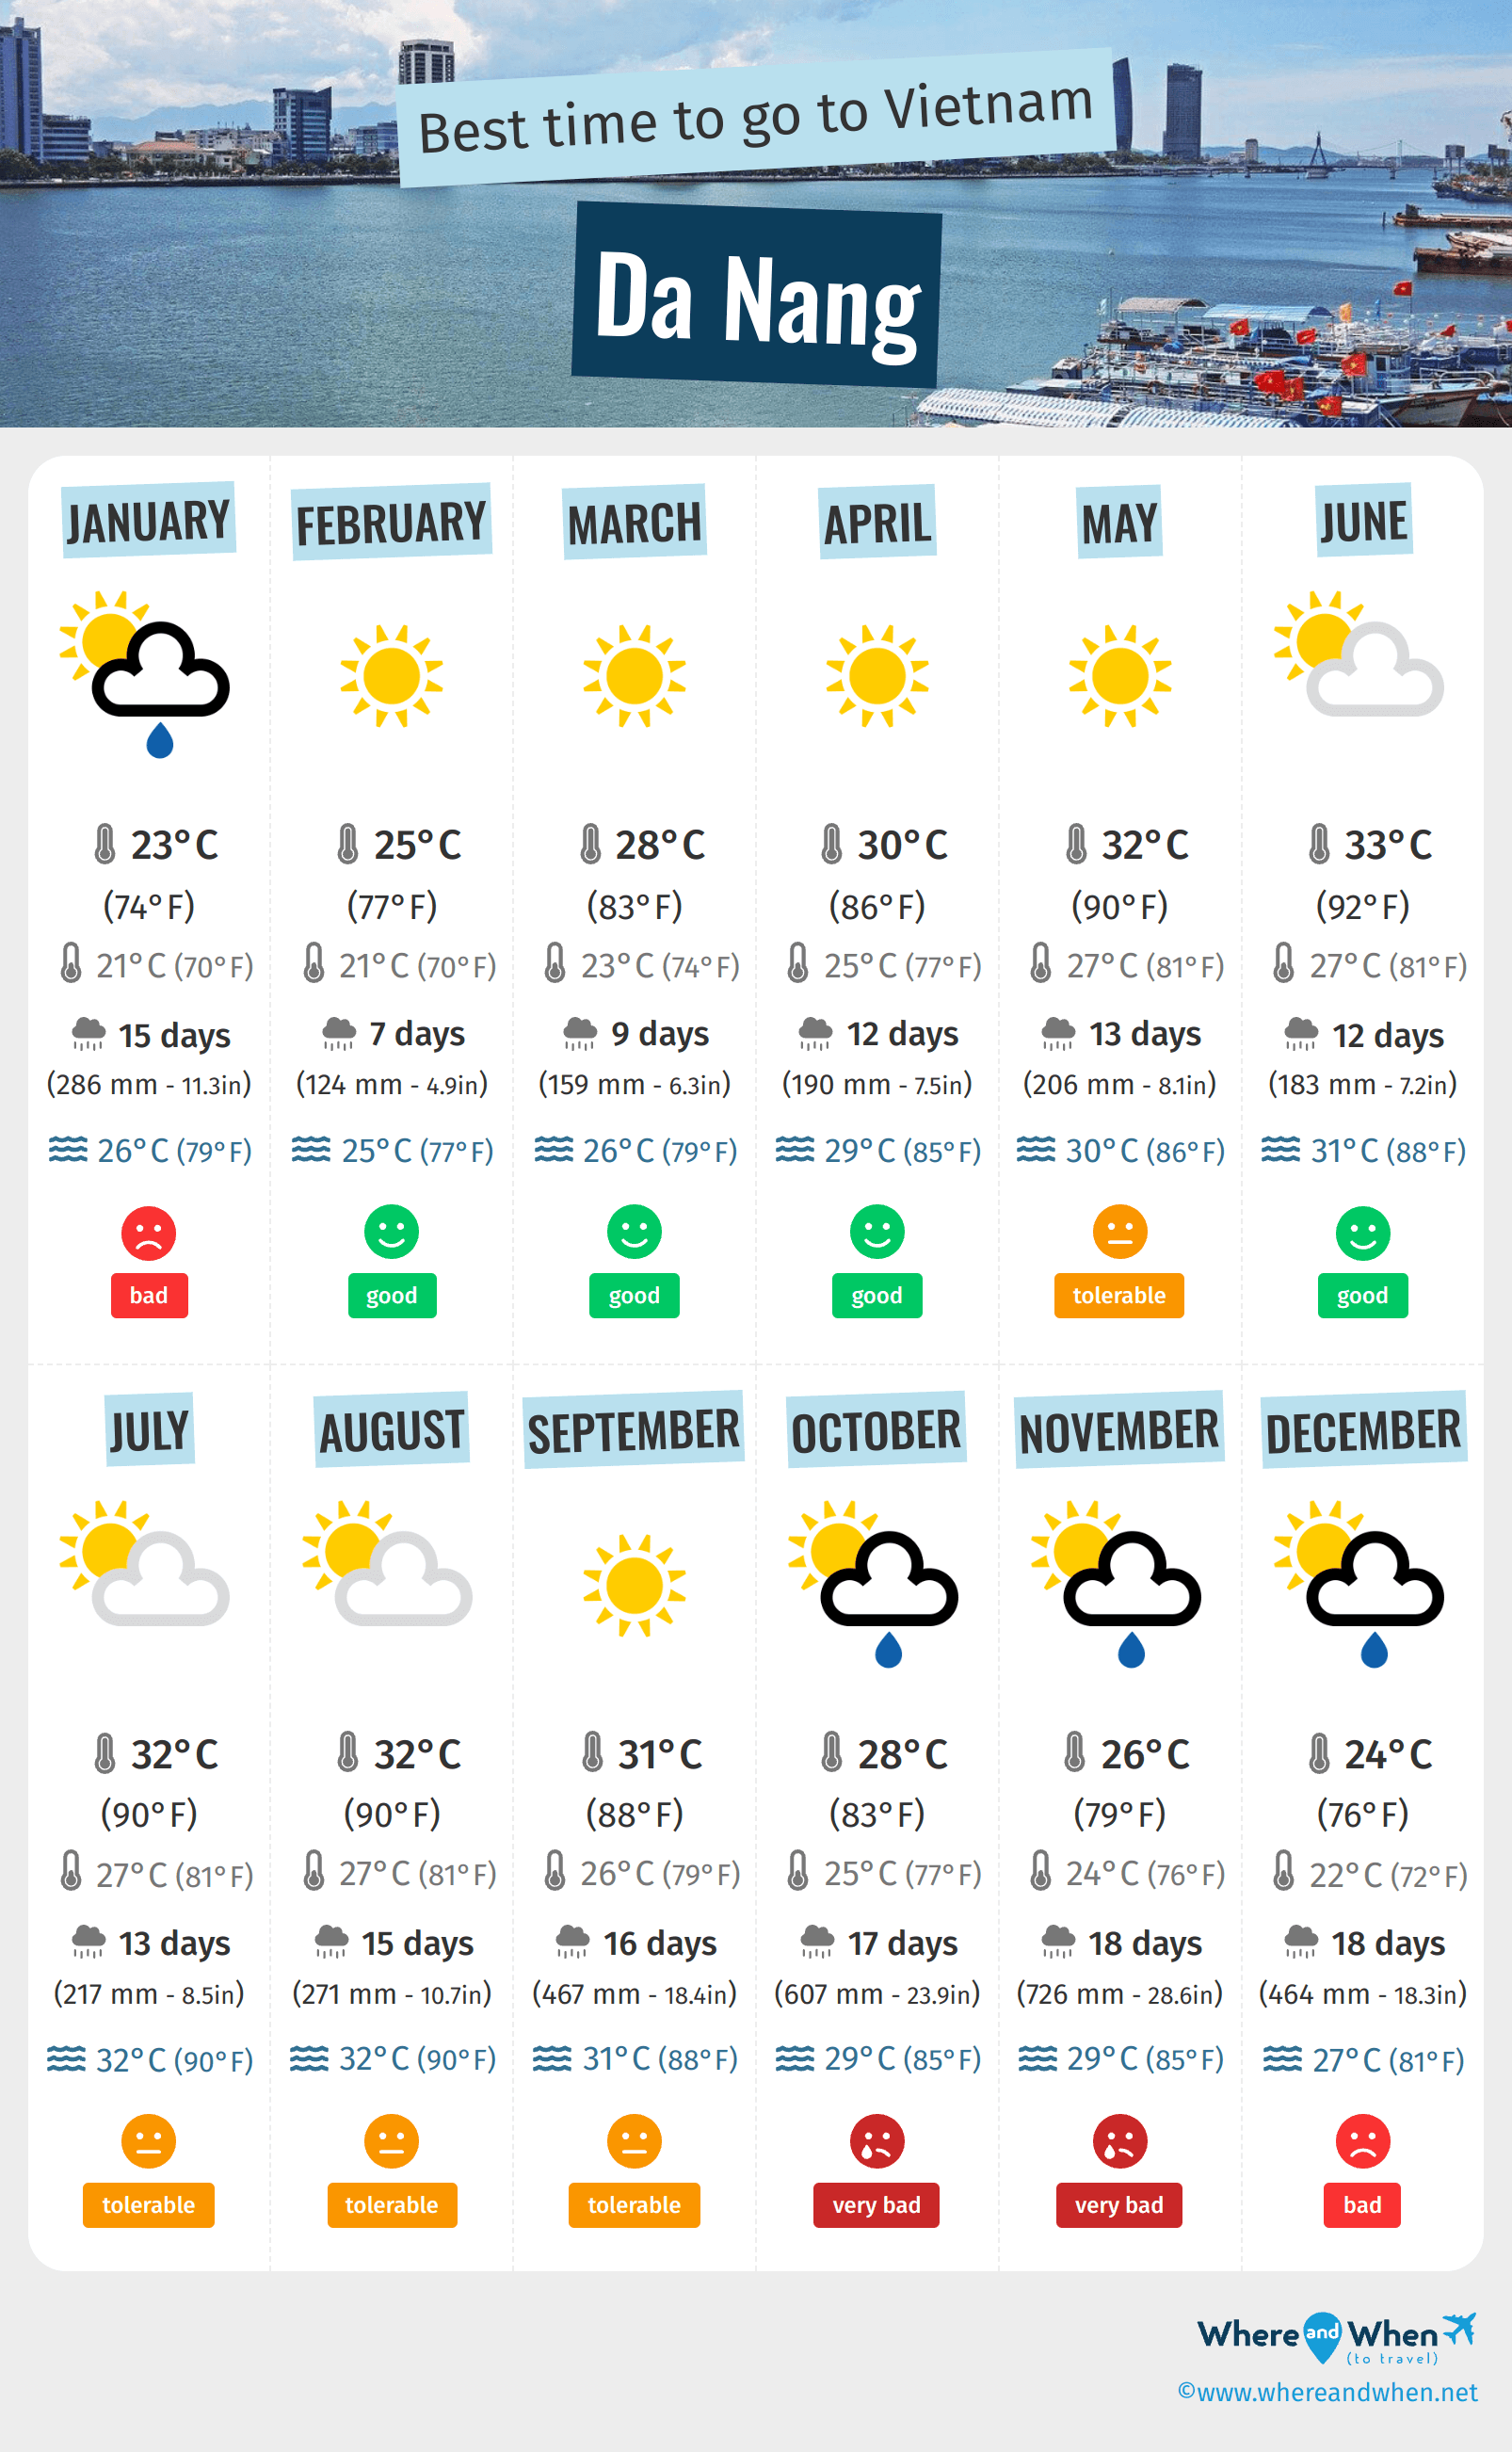
When is the best time to go to Da Nang? Here's some information to help you in your decision:
- The best months for good weather in Da Nang are February, March, April and June
- On average, the warmest months are April, May, June, July, August and September
- The rainiest months are October and November
- The best months for swimming are May, June, July, August, September, October and November
Annual weather in Da Nang
Weather details in Da Nang month by month
Weather and climate in Da Nang
Da Nang enjoys a tropical monsoon climate in accordance with the Köppen-Geiger classification. The yearly average maximum temperature in Da Nang is 85°F (ranging from 74°F in january to 92°F in june). Annual rainfall is 153.3in, with a minimum of 4.9in in february and a maximum of 28.6in in november.
- In the month of january the climate is not good. At lunchtime, it's 74°F in average and, in january, 15 days of rain are expected.
- Between february and april the climate is good. By early evening, the temperature averages 77°F and you can expect to have 7.5in of rainfall/month during this period.
- From may to august the climate is bad. It is for example 90°F as maximum temperature in august and it rains about 10.7in each month.
- In the month of september the climate is very unfavorable. the thermometer goes up to 88°F°C and it rains about 18.4in each month.
- In the month of october the climate is bad. At lunchtime, it's 83°F in average and, in october, 17 days of rain are expected.
- In november the climate is the worst possible. In average, on the morning it is 76°F and you can expect to have 28.6in of rainfall/month during this period.
- In the month of december the climate is not good. It is for example 76°F as maximum temperature in december and it rains in december about 18.3in.

Charts: temperature and rainfall in Da Nang
In the charts below, you can see the following seasonal norms for the city of Da Nang: the minimum and maximum outdoor temperature, the risk and amount of monthly rainfall, daily average sunshine, sea temperature, and relative humidity for each month of the year.
Outside temperature
Precipitation (rainfall)
Daily sunshine hours
Sea temperature
Humidity
Peak visitor numbers and tourist seasons in Da Nang
Find out when Da Nang has its high tourist season (the period when the influx of tourists is highest) and off-peak tourist season using our data and figures.
Tourist seasons in Da Nang
- Very low season in Da Nang
The months with the lowest number of tourists are: January, June and November. - Low season in Da Nang
The months with low numbers of tourists are: February, April, May and October. - High season in Da Nang
The number of visitors to Da Nang is high in: March and September. - Peak season in Da Nang
The largest number of tourists visiting Da Nang is during: July, August and December.
Figure: Visitor index for Da Nang month by month
Best time for low prices in Da Nang
Average prices of hotels in Da Nang month by month
Generally, November is the month with the lowest hotel prices in Da Nang. So this is a great time to save on your holiday! In contrast, April is statistically the most expensive month of the year for hotels.
Other cities and places near Da Nang


Chargement en cours
Legend:
 Da Nang
 other locations
Da Nang
other locations