Phatthalung in october: average Weather, Temperature and Climate
Weather in Phatthalung in october 2025
The weather in Phatthalung in the month of october comes from statistical datas on the last years. You can view the weather statistics for all the month, but also by using the tabs for the beginning, the middle and the end of the month.
Average weather throughout october
tolerable weather UV index: 7
Weather at 6am
79°F
 Partly Cloudy
43% of time

22%

16%

9%
Weather at 12pm
90°F
 Moderate rain at times
44% of time
24%

19%
11%
Weather at 6pm
81°F
Moderate rain at times
39% of time
39%
11%
9%
Weather at 3am
77°F

32%

24%

17%

15%
Evolution of daily average temperature and precipitation in Phatthalung in october
These charts show the evolution of average minimum/maximum temperatures as well as average daily precipitation volume in Phatthalung in october.
The climate of Phatthalung in october is tolerable
The weather in october in Phatthalung is wet (with 11.1in of rainfall over 16 days). This is better than the previous month since in september it receives an average of 8.9in of precipitation over 13 days.
The climate comfortable here this month. Temperatures are up to 90°F. The minimum is 79°F. Thus, the mean temperature average in october in Phatthalung is 85°F. Note that seasonal normals in contrast with those observed in Phatthalung in the month of october with a maximum record of 99°F in 2017 and a minimum record of 72°F in 2021. You can expect to have about 25 days with temperatures up to 86°F, or 81 of time.
Day length in Phatthalung in october is 11:57. The sun rises at 06:07 and sunset is at 18:04.
With a correct climate, the month of october is okay (but not good) to go in Phatthalung in Thailand.
October: another location in Thailand?
If you want to go to Thailand in october, there are destinations with better weather than Phatthalung:
In october, Chiang Mai, Doi Inthanon and Lamphun have perfect weather.
Furthermore, Chiang Rai, Khon Kaen, Ubon Ratchathani (Isan), Burinam, Chon Buri and Doi Pha Hom Pok National Park have good weather.
Seasonal average climate and temperature of Phatthalung in october
Check below seasonal norms These statistics are set from the weather statements of the last years of the month of october.
| October | |||||
| Outside temperature | |||||
| Average temperature | 85°F | ||||
| Highest temperature | 90°F | ||||
| Lowest temperature | 79°F | ||||
| Highest record temperature | 99°F (2017) | ||||
| Lowest record temperature | 72°F (2021) | ||||
| Number of days at +86°F | 25 day(s) (81%) | ||||
| Number of days at +65°F | 31 day(s) (100%) | ||||
| Wind | |||||
| Wind speed | 10km/h | ||||
| Wind temperature | 79°F | ||||
| Precipitation (rainfall) | |||||
| Rainfall | 11.1in | ||||
| Number of days with rainfall | 16 day(s) (51%) | ||||
| Record daily rainfall | 3.2in (2014) | ||||
| Other climate data | |||||
| Humidity | 89% | ||||
| Visibility | 8.66km | ||||
| Cloud cover | 43% | ||||
| UV index | 7 | ||||
| Daily sunshine hours | 11 | ||||
| Sunrise and sunset | |||||
| Time of sunrise | 06:07 | ||||
| Time of sunset | 18:04 | ||||
| Length of day | 11:57 | ||||
| Our opinion about the weather in october | |||||
| Our opinion at whereandwhen.net | tolerable | ||||
How was the weather last october?
Here is the day by day recorded weather in Phatthalung in october 2024:

77°F to 88°F

79°F to 86°F
79°F to 86°F
77°F to 85°F
79°F to 85°F

77°F to 83°F
77°F to 83°F

79°F to 85°F
79°F to 86°F
79°F to 85°F
79°F to 85°F
79°F to 85°F
79°F to 85°F
79°F to 85°F
79°F to 85°F
79°F to 81°F
79°F to 86°F
79°F to 81°F

76°F to 81°F

76°F to 81°F
79°F to 86°F
79°F to 88°F
79°F to 85°F
79°F to 86°F
79°F to 85°F
79°F to 86°F
79°F to 86°F
79°F to 86°F
77°F to 88°F
79°F to 88°F
79°F to 86°F
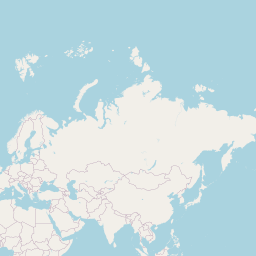
Map: other cities in Thailand in october
Cities near Phatthalung:
| Trang in october | tolerable weather |
| Songkhla in october | tolerable weather |
| Koh Sukon in october | tolerable weather |
| Hat Yai in october | tolerable weather |
| Koh Libong in october | tolerable weather |
| Koh Muk (Ko Mook) in october | tolerable weather |
| Nakhon Si Thammarat in october | good weather |
| Koh Bulon Leh in october | bad weather |
| Chawang in october | good weather |
| Koh Lanta in october | tolerable weather |
| Satun in october | tolerable weather |
| Sadao in october | tolerable weather |
Click over cities on the map for information about the weather in october.


 Phatthalung
 perfect weather
 good
good
 tolerable
 bad
bad
 very bad
Weather data for Phatthalung in october:
Weather data for Phatthalung for october are derived from an average of the weather forecast since 2009 in Phatthalung. There is a margin of error and these forecasts are to be considered as general information only. The weather in Phatthalung can vary slightly from year to year, but this data should limit surprises. So you can pack your bags or check for the best time in year to go to Phatthalung.