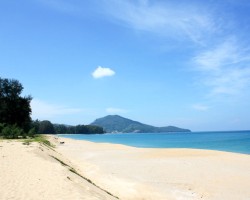
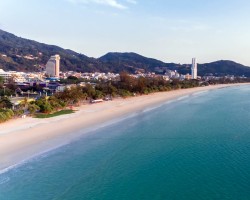
Best time to go to Sai Kaew Beach Average weather of Sai Kaew Beach, Phuket
When is the best time to go to Sai Kaew Beach?
When is the best time to go to Sai Kaew Beach? Here's some information to help you in your decision:
- The best months for good weather in Sai Kaew Beach are January, February and March
- On average, it is hot all year round
- The rainiest months are May, June, July, August, September and October
- The sea temperature is suitable for swimming all year round
Annual weather in Sai Kaew Beach
For full information about the climate and weather in Sai Kaew Beach a specific month, click on the corresponding line below:
| Month | Our opinion | ||||
|---|---|---|---|---|---|
| January | 79°F/85°F | good weather | Sai Kaew Beach in january | ||
| February | 79°F/86°F | good weather | Sai Kaew Beach in february | ||
| March | 81°F/88°F | good weather | Sai Kaew Beach in march | ||
| April | 83°F/88°F | tolerable weather | Sai Kaew Beach in april | ||
| May | 85°F/86°F | bad weather | Sai Kaew Beach in may | ||
| June | 83°F/86°F | tolerable weather | Sai Kaew Beach in june | ||
| July | 83°F/85°F | tolerable weather | Sai Kaew Beach in july | ||
| August | 83°F/85°F | tolerable weather | Sai Kaew Beach in august | ||
| September | 83°F/85°F | tolerable weather | Sai Kaew Beach in september | ||
| October | 81°F/85°F | tolerable weather | Sai Kaew Beach in october | ||
| November | 81°F/86°F | tolerable weather | Sai Kaew Beach in november | ||
| December | 79°F/85°F | tolerable weather | Sai Kaew Beach in december |


Weather and climate in Sai Kaew Beach
Sai Kaew Beach enjoys a tropical monsoon climate in accordance with the Köppen-Geiger classification. The yearly average maximum temperature in Sai Kaew Beach is 86°F (ranging from 85°F in september to 88°F in april). Annual rainfall is 150in, with a minimum of 3.1in in february and a maximum of 18in in july.
- In the month of january the climate is correct. the thermometer goes up to 85°F°C and it rains about 34% of the time in january.
- In the month of february the climate is beautiful. the thermometer goes up to 86°F°C.
- Between the months of march and december the climate is correct. At lunchtime, it's 85°F in average and, in december, 13 days of rain are expected.
Charts: temperature and rainfall in Sai Kaew Beach
In the charts below, you can see the following seasonal norms for the city of Sai Kaew Beach: the minimum and maximum outdoor temperature, the risk and amount of monthly rainfall, daily average sunshine, sea temperature, and relative humidity for each month of the year.
Outside temperature
Precipitation (rainfall)
Daily sunshine hours
Sea temperature
Humidity
Other cities and places near Sai Kaew Beach


Chargement en cours
Legend:
 Sai Kaew Beach
 other locations
Sai Kaew Beach
other locations