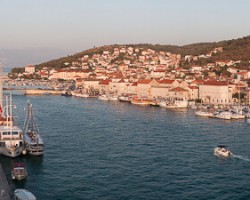
Best time to go to Šibenik Average weather of Šibenik, Croatia
When is the best time to go to Šibenik?
When is the best time to go to Šibenik? Here's some information to help you in your decision:
- The best months for good weather in Šibenik are April, May, June, July, August, September, October and November
- On average, the warmest months are July and August
- The coldest months are January and February
- November is the rainiest month
- The best months for swimming are June, July, August and September
Annual weather in Šibenik
For full information about the climate and weather in Šibenik a specific month, click on the corresponding line below:
| Month | Our opinion | ||||
|---|---|---|---|---|---|
| January | 43°F/50°F | bad weather | Šibenik in january | ||
| February | 43°F/52°F | bad weather | Šibenik in february | ||
| March | 49°F/58°F | tolerable weather | Šibenik in march | ||
| April | 56°F/63°F | good weather | Šibenik in april | ||
| May | 63°F/70°F | good weather | Šibenik in may | ||
| June | 72°F/79°F | perfect weather | Šibenik in june | ||
| July | 76°F/85°F | perfect weather | Šibenik in july | ||
| August | 76°F/86°F | perfect weather | Šibenik in august | ||
| September | 68°F/77°F | good weather | Šibenik in september | ||
| October | 59°F/68°F | good weather | Šibenik in october | ||
| November | 54°F/61°F | good weather | Šibenik in november | ||
| December | 47°F/52°F | bad weather | Šibenik in december |

Weather and climate in Šibenik
- Between the months of january and february the climate is not good. It is for example 52°F as maximum temperature in february.
- In march the climate is correct. The record temperature this month is 70°F and it rains about 23% of the time in march.
- Between april and june the climate is good. By early evening, the temperature averages 74°F and it rains in june about 3in.
- From july to august the climate is very good. In average, on the morning it is 76°F and it rains in august about 1.6in.
- Between the months of september and october the climate is favorable. The temperature rises to 68°F and you can expect to have 5.1in of rainfall/month during this period.
- In the month of november the climate is okay. At lunchtime, it's 61°F in average and you can expect to have 7.7in of rainfall/month during this period.
- In the month of december the climate is unfavorable. In average, on the morning it is 47°F and it rains in december about 5.7in.

Charts: temperature and rainfall in Šibenik
In the charts below, you can see the following seasonal norms for the city of Šibenik: the minimum and maximum outdoor temperature, the risk and amount of monthly rainfall, daily average sunshine, sea temperature, and relative humidity for each month of the year.
Outside temperature
Precipitation (rainfall)
Daily sunshine hours
Sea temperature
Humidity
Peak visitor numbers and tourist seasons in Šibenik
Find out when Šibenik has its high tourist season (the period when the influx of tourists is highest) and off-peak tourist season using our data and figures.
Tourist seasons in Šibenik
- Very low season in Šibenik
The months with the lowest number of tourists are: January, February, March, April, October and December. - Low season in Šibenik
The months with low numbers of tourists are: May, June, September and November. - Peak season in Šibenik
The largest number of tourists visiting Šibenik is during: July and August.
Figure: Visitor index for Šibenik month by month
Best time for low prices in Šibenik
Average price of hiring a car in Šibenik
On average, it costs $ 29 per day to hire a car in Šibenik. This price varies by $ 39 depending on the month. In november, hiring a car costs an average of $ 19 per 24 hours, so this is the best time to save money! In contrast, the average price in july is $ 57.
Other cities and places near Šibenik


 Šibenik
 other locations