Best time to go to Gangtok Average weather of Gangtok, India
When is the best time to go to Gangtok?
When is the best time to go to Gangtok? Here's some information to help you in your decision:
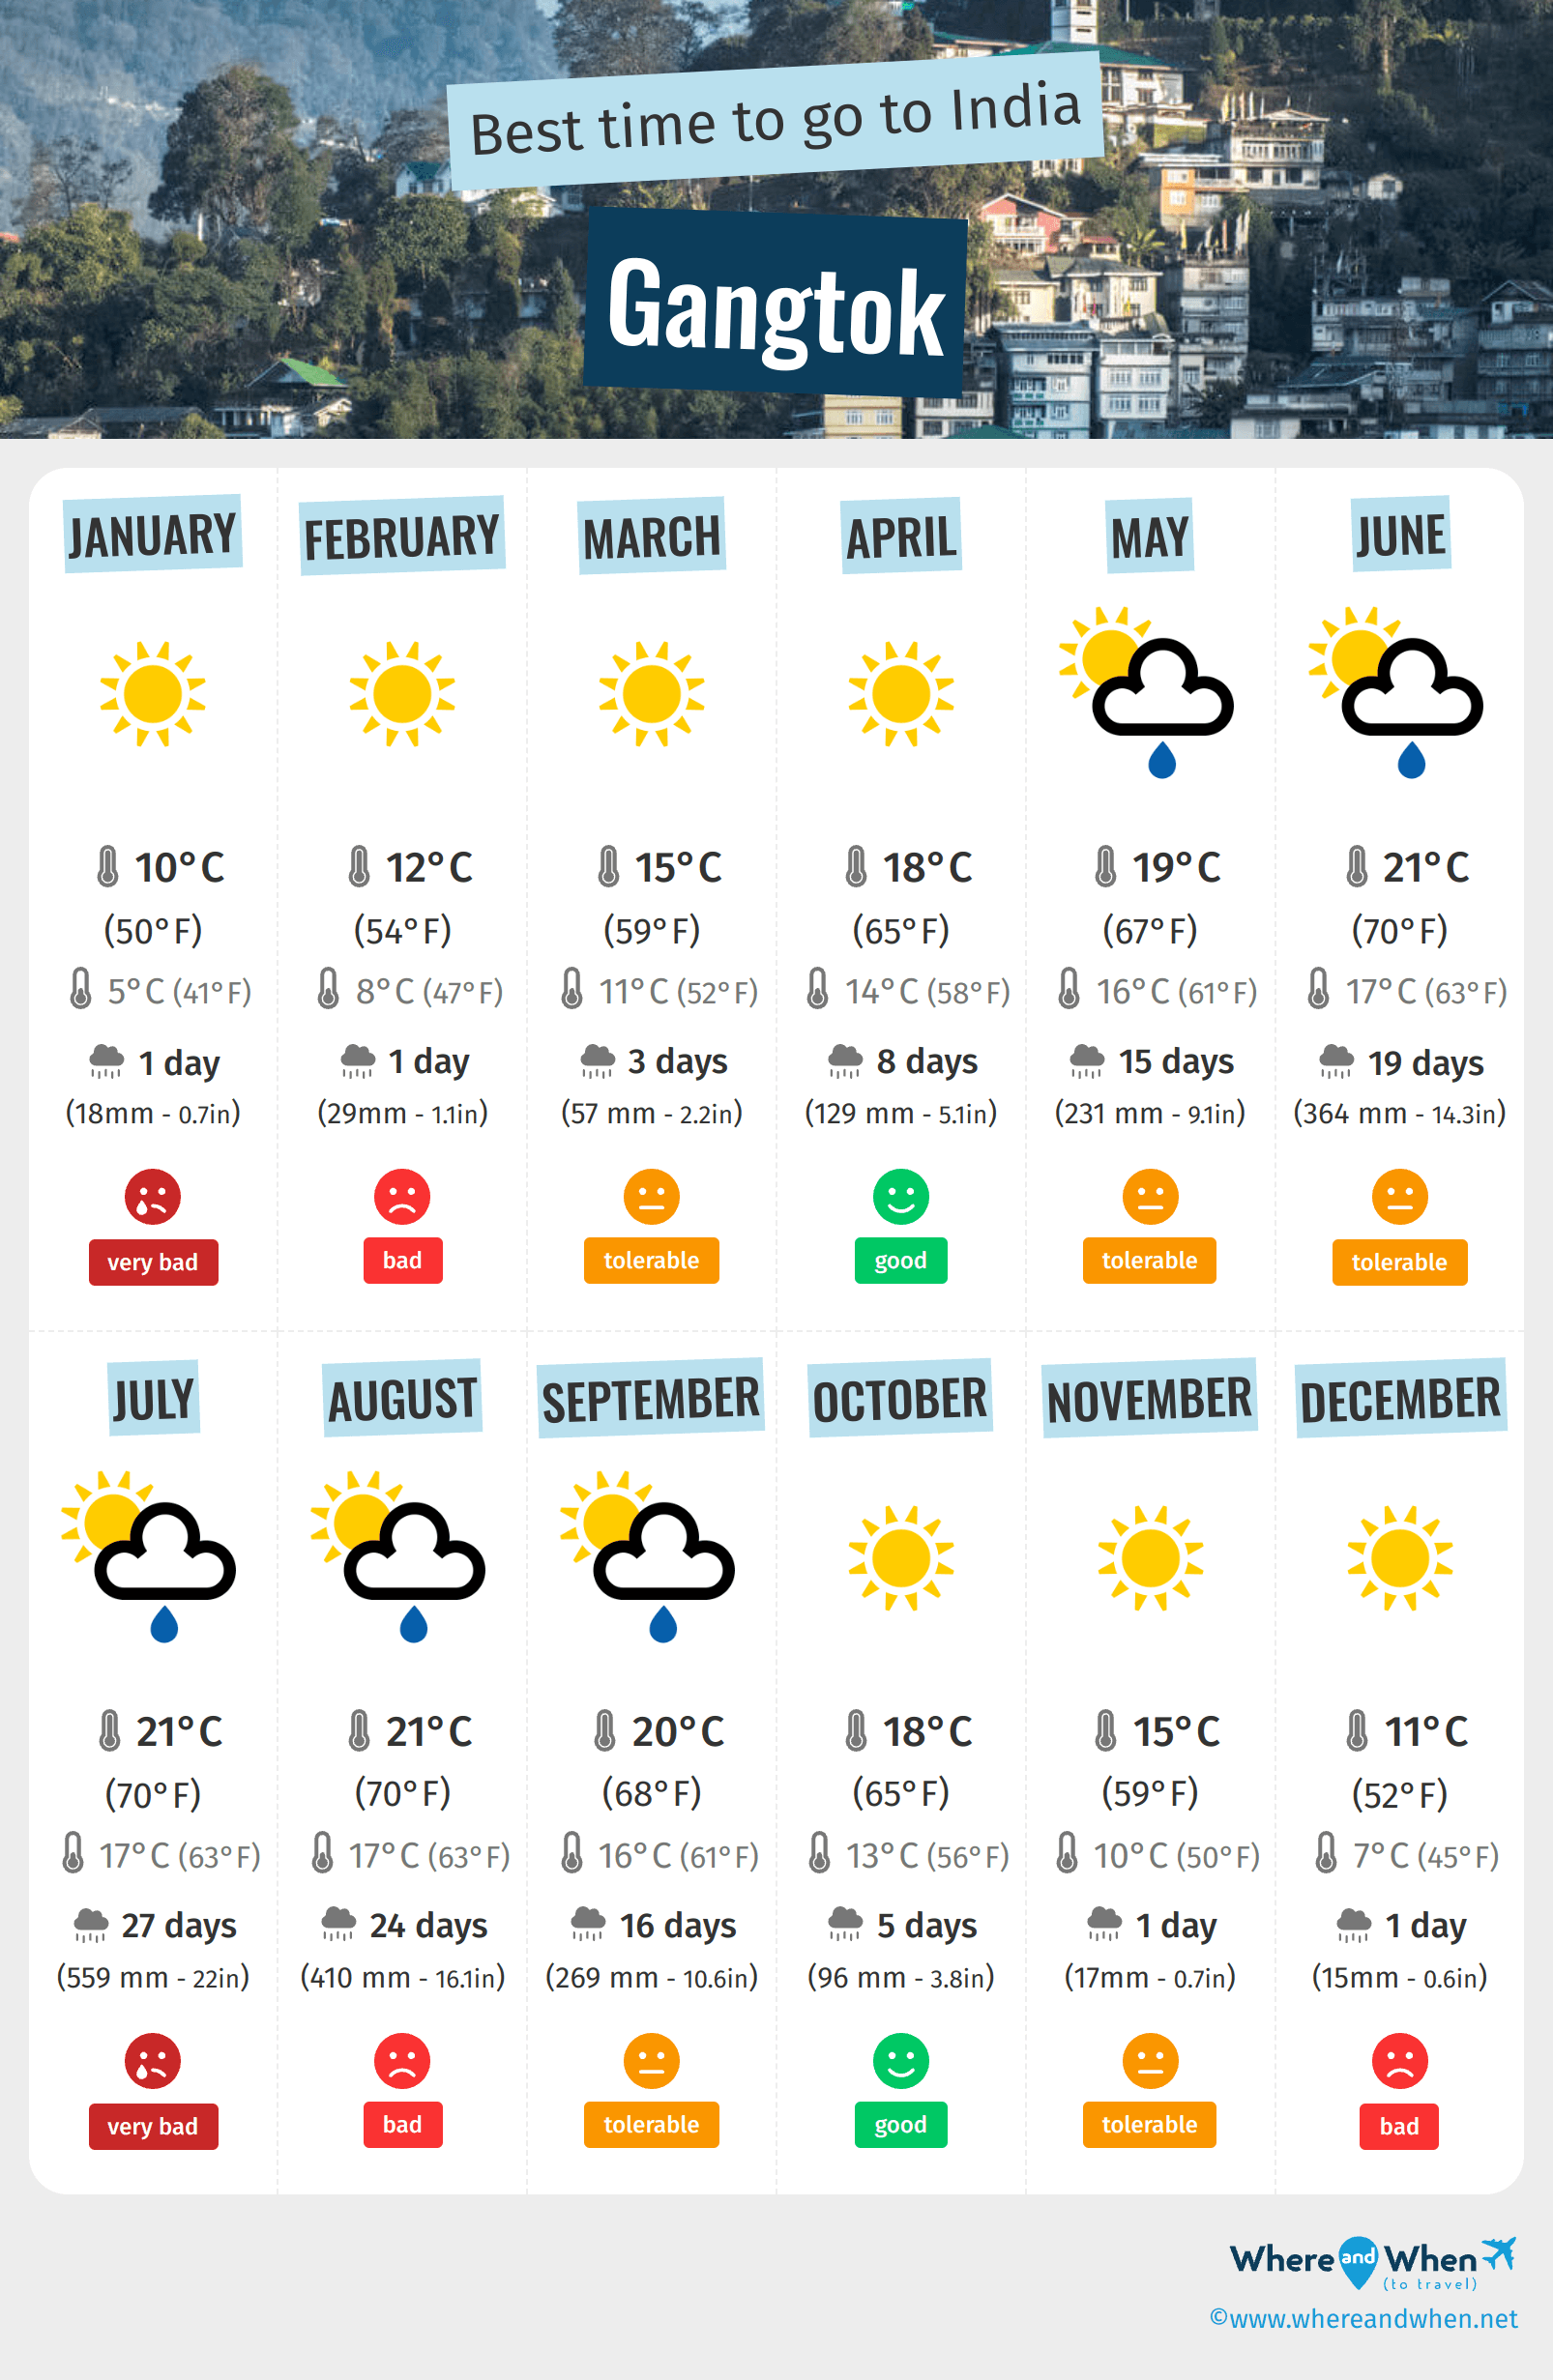
- The best months for good weather in Gangtok are April and October
- On average, the warmest months are May, June, July, August and September
- January is the coldest month of the year
- July is the rainiest month
Annual weather in Gangtok
Weather details in Gangtok month by month
Weather and climate in Gangtok
Gangtok enjoys a subtropical highland climate (with dry winter) in accordance with the Köppen-Geiger classification. The yearly average maximum temperature in Gangtok is 63°F (ranging from 50°F in january to 70°F in august). Annual rainfall is 86.1in, with a minimum of 0.6in in december and a maximum of 22in in july.
- In january the climate is very unfavorable. By early evening, the temperature averages 41°F and it rains in january about 0.7in.
- In february the climate is bad. The temperature rises to 54°F and, in february, 1 days of rain are expected.
- In the month of march the climate is not good, but still OK. The temperature rises to 59°F and you can expect to have 2.2in of rainfall/month during this period.
- In april the climate is favorable. At lunchtime, it's 63°F in average and it rains about 5.1in each month.
- In the month of may the climate is okay. The record temperature this month is 76°F and it rains about 9.1in each month.
- Between the months of june and august the climate is the worst possible. The temperature rises to 70°F and it rains in august about 16.1in.
- In september the climate is passable, but still OK. the thermometer goes up to 68°F°C and, in september, 16 days of rain are expected.
- In the month of october the climate is good. The record temperature this month is 85°F.
- In the month of november the climate is correct. At lunchtime, it's 58°F in average and, in november, 1 days of rain are expected.
- In december the climate is not good. At lunchtime, it's 52°F in average and, in december, 1 days of rain are expected.

Charts: temperature and rainfall in Gangtok
In the charts below, you can see the following seasonal norms for the city of Gangtok: the minimum and maximum outdoor temperature, the risk and amount of monthly rainfall, daily average sunshine, and relative humidity for each month of the year.
Outside temperature
Precipitation (rainfall)
Daily sunshine hours
Humidity
Peak visitor numbers and tourist seasons in Gangtok
Find out when Gangtok has its high tourist season (the period when the influx of tourists is highest) and off-peak tourist season using our data and figures.
Tourist seasons in Gangtok
- Very low season in Gangtok
The months with the lowest number of tourists are: January, February, July and August. - Low season in Gangtok
The months with low numbers of tourists are: March, April and September. - High season in Gangtok
The number of visitors to Gangtok is high in: June and November. - Peak season in Gangtok
The largest number of tourists visiting Gangtok is during: May, October and December.
Figure: Visitor index for Gangtok month by month
Other cities and places near Gangtok


Chargement en cours
Legend:
 Gangtok
 other locations
Gangtok
other locations