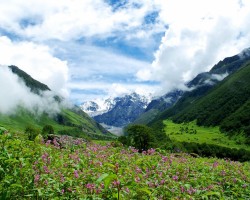
Best time to go to Chandigarh Average weather of Chandigarh, India
When is the best time to go to Chandigarh?
When is the best time to go to Chandigarh? Here's some information to help you in your decision:
- The best months for good weather in Chandigarh are January, February, March, April, May, September, October, November and December
- On average, the warmest months are May and June
- November is the driest month
- January is the coldest month of the year
- The rainiest months are July and August
Annual weather in Chandigarh
For full information about the climate and weather in Chandigarh a specific month, click on the corresponding line below:
| Month | Our opinion | ||||
|---|---|---|---|---|---|
| January | 52°F/68°F | good weather | Chandigarh in january | ||
| February | 58°F/74°F | perfect weather | Chandigarh in february | ||
| March | 68°F/85°F | perfect weather | Chandigarh in march | ||
| April | 79°F/97°F | perfect weather | Chandigarh in april | ||
| May | 88°F/104°F | good weather | Chandigarh in may | ||
| June | 90°F/106°F | tolerable weather | Chandigarh in june | ||
| July | 85°F/99°F | tolerable weather | Chandigarh in july | ||
| August | 81°F/94°F | bad weather | Chandigarh in august | ||
| September | 79°F/92°F | good weather | Chandigarh in september | ||
| October | 74°F/90°F | perfect weather | Chandigarh in october | ||
| November | 65°F/81°F | perfect weather | Chandigarh in november | ||
| December | 56°F/72°F | good weather | Chandigarh in december |


Weather and climate in Chandigarh
Chandigarh enjoys a monsoon-influenced humid subtropical climate in accordance with the Köppen-Geiger classification. The yearly average maximum temperature in Chandigarh is 88°F (ranging from 68°F in january to 106°F in june). Annual rainfall is 56.1in, with a minimum of 0.4in in november and a maximum of 17.5in in august.
- In january the climate is favorable. the thermometer goes up to 68°F°C and it rains about 9% of the time in january.
- Between the months of february and april the climate is perfect. In average, on the morning it is 79°F and you can expect to have 1.3in of rainfall/month during this period.
- In may the climate is favorable. The record temperature this month is 115°F and it rains in may about 1.7in.
- From june to august the climate is passable, but still OK. At lunchtime, it's 94°F in average and, in august, 20 days of rain are expected.
- In the month of september the climate is favorable. At lunchtime, it's 92°F in average and it rains in september about 9.1in.
- Between october and november the climate is perfect. By early evening, the temperature averages 65°F and it rains about 0.4in each month.
- In december the climate is beautiful. the thermometer goes up to 72°F°C and it rains in december about 0.7in.
Charts: temperature and rainfall in Chandigarh
In the charts below, you can see the following seasonal norms for the city of Chandigarh: the minimum and maximum outdoor temperature, the risk and amount of monthly rainfall, daily average sunshine, and relative humidity for each month of the year.
Outside temperature
Precipitation (rainfall)
Daily sunshine hours
Humidity
Other cities and places near Chandigarh


Chargement en cours
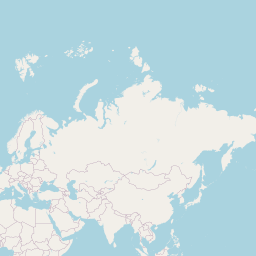


Leaflet | © OpenStreetMap contributors
Legend:
 Chandigarh
 other locations
Chandigarh
other locations