Best time to go to Murdeira Average weather of Murdeira, Cape Verde
When is the best time to go to Murdeira?
When is the best time to go to Murdeira? Here's some information to help you in your decision:
- The weather is good all year round in Murdeira
- On average, the warmest months are August, September, October and November
- Murdeira has dry periods in January, February, March, April, May, June, July, November and December
- September is the rainiest month
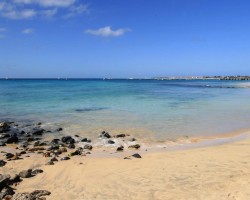
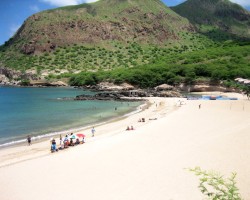
- The best months for swimming are September and October
Annual weather in Murdeira
To get all the information about the climate and weather in Murdeira for a specific month, scroll down below the table and choose a month from the tabs.
| Month | Our opinion | |||
|---|---|---|---|---|
| January | 72°F/74°F | perfect weather | ||
| February | 70°F/72°F | perfect weather | ||
| March | 70°F/72°F | perfect weather | ||
| April | 70°F/72°F | perfect weather | ||
| May | 72°F/74°F | perfect weather | ||
| June | 74°F/76°F | perfect weather | ||
| July | 76°F/77°F | good weather | ||
| August | 77°F/79°F | good weather | ||
| September | 81°F/83°F | good weather | ||
| October | 79°F/81°F | perfect weather | ||
| November | 77°F/79°F | perfect weather | ||
| December | 74°F/76°F | perfect weather |


Weather detail month by month in Murdeira

Weather and climate in Murdeira
Murdeira enjoys a hot desert climate in accordance with the Köppen-Geiger classification. The yearly average maximum temperature in Murdeira is 76°F (ranging from 72°F in march to 83°F in september). Annual rainfall is 6.7in, with a minimum of 0in in january and a maximum of 2.7in in september.
- Between the months of january and june the climate is very good. The record temperature this month is 79°F and it rains about 0.1in each month.
- Between the months of july and september the climate is favorable. At lunchtime, it's 81°F in average and it rains about 28% of the time in september.
- From october to december the climate is very good. At lunchtime, it's 76°F in average and it rains in december about 0.2in.

Charts: temperature and rainfall in Murdeira
In the charts below, you can see the following seasonal norms for the city of Murdeira: the minimum and maximum outdoor temperature, the risk and amount of monthly rainfall, daily average sunshine, sea temperature, and relative humidity for each month of the year.
Outside temperature
Precipitation (rainfall)
Daily sunshine hours
Sea temperature
Humidity
Peak visitor numbers and tourist seasons in Murdeira
Find out when Murdeira has its high tourist season (the period when the influx of tourists is highest) and off-peak tourist season using our data and figures.
Tourist seasons in Murdeira
- Very low season in Murdeira
The months with the lowest number of tourists are: March, May, June and September. - Low season in Murdeira
The months with low numbers of tourists are: January, April, July and October. - High season in Murdeira
The number of visitors to Murdeira is high in: February. - Peak season in Murdeira
The largest number of tourists visiting Murdeira is during: August, November and December.
Figure: Visitor index for Murdeira month by month
Other cities and places near Murdeira


Chargement en cours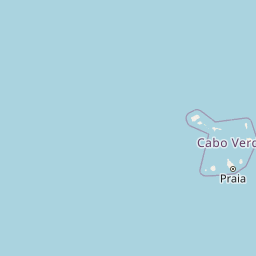
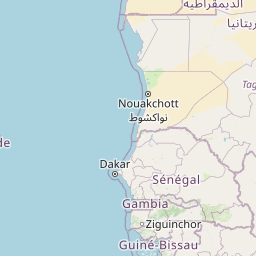


Leaflet | © OpenStreetMap contributors
Legend:
 Murdeira
 other locations
Murdeira
other locations