Best time to go to Ploče Average weather of Ploče, Croatia
When is the best time to go to Ploče?
When is the best time to go to Ploče? Here's some information to help you in your decision:
- The best months for good weather in Ploče are April, May, June, July, August, September and October
- On average, the warmest months are July and August
- January is the coldest month of the year
- The rainiest months are January, February, November and December
- The best months for swimming are June, July, August and September
Annual weather in Ploče
To get all the information about the climate and weather in Ploče for a specific month, scroll down below the table and choose a month from the tabs.
| Month | Our opinion | |||
|---|---|---|---|---|
| January | 40°F/49°F | very bad weather | ||
| February | 40°F/52°F | very bad weather | ||
| March | 45°F/58°F | tolerable weather | ||
| April | 54°F/63°F | good weather | ||
| May | 61°F/70°F | good weather | ||
| June | 70°F/81°F | good weather | ||
| July | 76°F/86°F | perfect weather | ||
| August | 76°F/90°F | perfect weather | ||
| September | 67°F/81°F | good weather | ||
| October | 58°F/70°F | good weather | ||
| November | 52°F/61°F | tolerable weather | ||
| December | 43°F/52°F | bad weather |

Weather detail month by month in Ploče

Weather and climate in Ploče
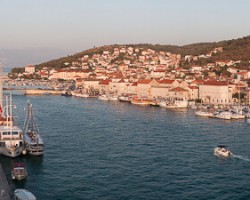
Ploče enjoys a warm-summer Mediterranean climate in accordance with the Köppen-Geiger classification. The yearly average maximum temperature in Ploče is 68°F (ranging from 49°F in january to 90°F in august). Annual rainfall is 79in, with a minimum of 1.8in in august and a maximum of 10.7in in november.
- From january to february the climate is the worst possible. In average, on the morning it is 41°F and it rains about 9.3in each month.
- In the month of march the climate is correct. The record temperature this month is 72°F and it rains about 7.7in each month.
- Between april and july the climate is favorable. the thermometer goes up to 86°F°C and it rains about 10% of the time in july.
- In august the climate is perfect. the thermometer goes up to 90°F°C.
- From september to october the climate is favorable. the thermometer goes up to 70°F°C and it rains in october about 7.4in.
- In the month of november the climate is okay. At lunchtime, it's 61°F in average and it rains in november about 10.7in.
- In december the climate is not good. At lunchtime, it's 52°F in average and it rains about 28% of the time in december.
Charts: temperature and rainfall in Ploče
In the charts below, you can see the following seasonal norms for the city of Ploče: the minimum and maximum outdoor temperature, the risk and amount of monthly rainfall, daily average sunshine, sea temperature, and relative humidity for each month of the year.
Outside temperature
Precipitation (rainfall)
Daily sunshine hours
Sea temperature
Humidity
Other cities and places near Ploče


Chargement en cours


Leaflet | © OpenStreetMap contributors
Legend:
 Ploče
Ploče
 other locations
Ploče
other locations