Best time to go to Playa del Carmen Average weather of Playa del Carmen, Mexico
When is the best time to go to Playa del Carmen?
Located in Mexico on the Yucatan Peninsula, Playa del Carmen is part of a tourist area along the Caribbean Sea in the state of Quintana Roo known as the Riviera Maya. The best time to visit Playa del Carmen, taking into account the weather, is generally during the dry season from November to May. However, the month of March stands out as the most ideal option to fully enjoy favorable weather with little rain.
During these months, you can expect pleasant temperatures and generally dry weather, making outdoor activities particularly enjoyable. Whether you want to lounge on golden beaches, explore majestic cenotes, or discover the beauty of marine life through diving, these months offer optimal conditions.
Furthermore, the water temperature in Playa del Carmen remains favorable for swimming all year round, ranging between 25°C and 31°C (88°F) . Whether for a refreshing swim or to explore the wonders of the Mesoamerican Barrier Reef, you can dive into these crystal-clear waters at any time of the year.
That being said, the peak tourist season in Playa del Carmen corresponds to November to January and April. During these months, the city is generally more lively, with a variety of cultural events and festivals. However, this also means that prices can be higher and places more crowded.
If you prefer to avoid the crowds, consider visiting the city in May-June or September-October. This can allow you to enjoy a more authentic and peaceful experience.
In summary, the ideal visiting period depends on your personal preferences. Whether you are looking for the best weather, warm sea for swimming, a lively city with many events, or a quieter experience, Playa del Carmen has something to offer throughout the year.
So, when is the best time to go to Playa del Carmen? Here's some more information to help you in your decision:
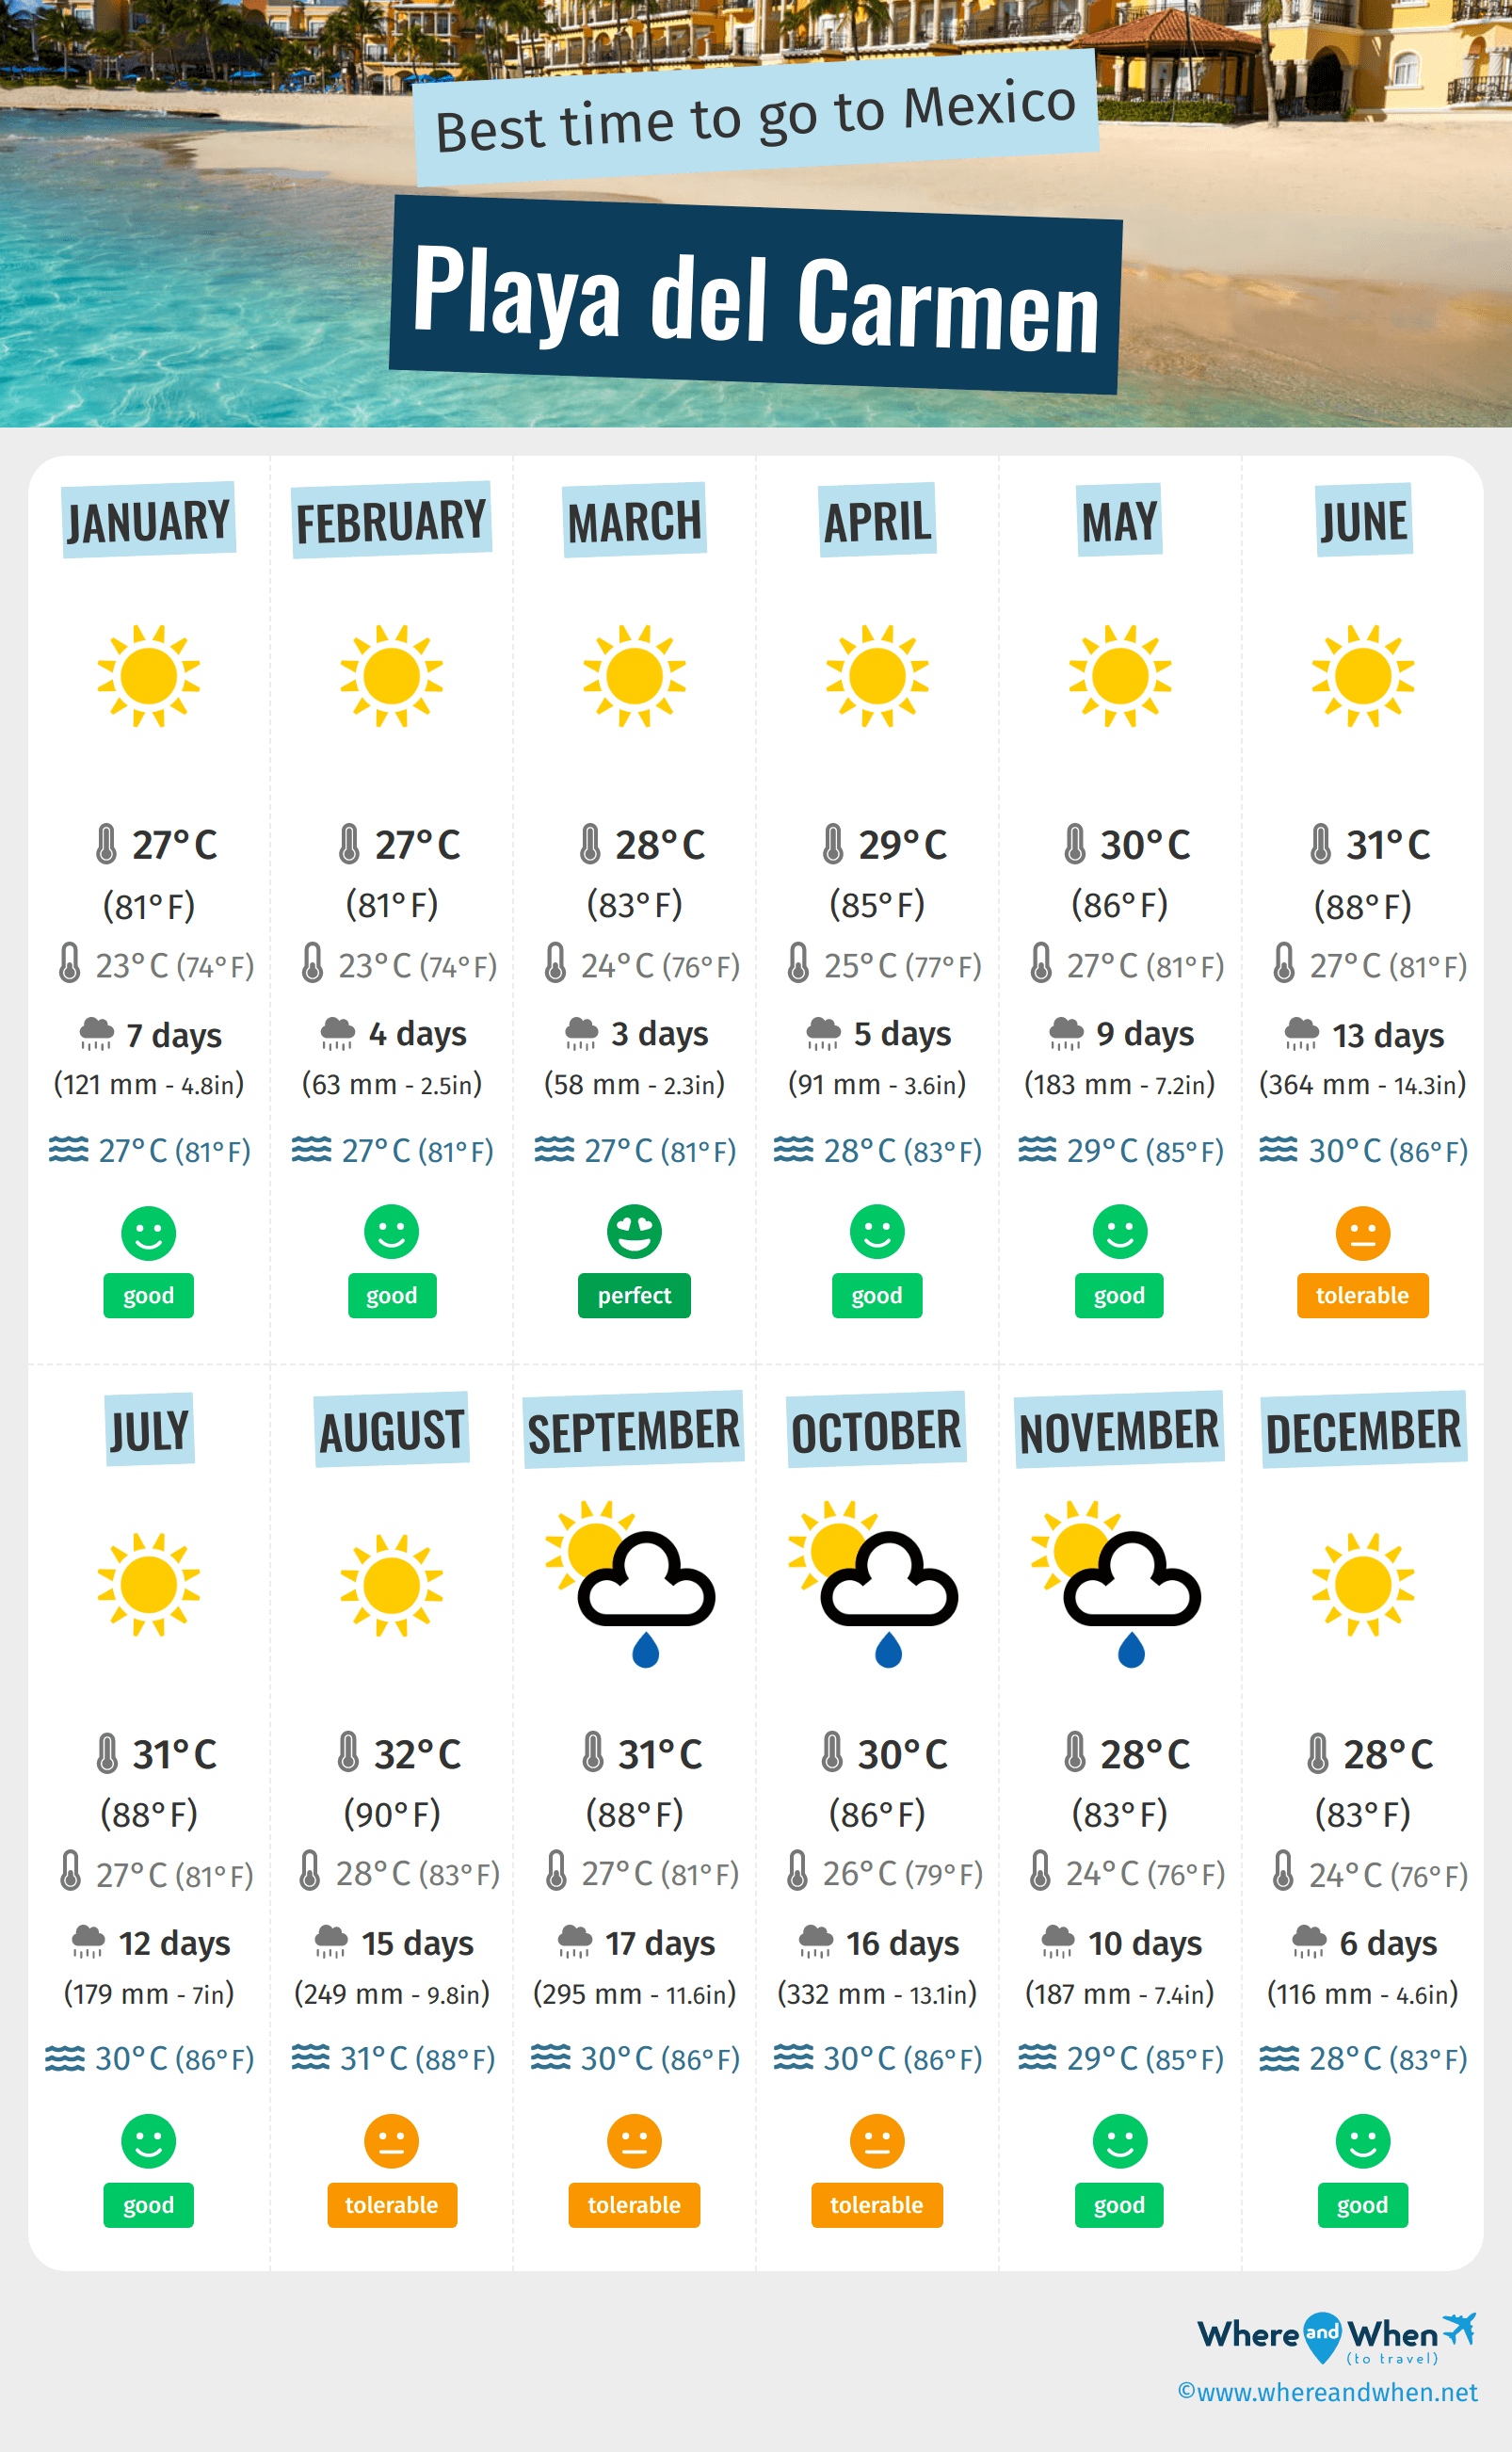
- The best months for good weather in Playa del Carmen are January, February, March, April, May, July, November and December
- On average, the warmest months are April, May, June, July, August, September and October
- The rainiest months are June, September and October
- The best months for swimming are April, May, June, July, August, September, October, November and December
Annual weather in Playa del Carmen
Weather details in Playa del Carmen month by month
Weather and climate in Playa del Carmen
One of the most popular destinations in the Riviera Maya, Playa del Carmen offers its visitors the opportunity to swim all year round, thanks to the pleasant temperature of the seawater. Like Cancun, this seaside resort, located on the Yucatan Peninsula, is characterized by a tropical climate which is marked by almost constant heat and showers. It has two distinct seasons, the wet season, which runs from June to October, and the dry season, the rest of the year. In reality, the dry season means a noticeable decrease in showers as the rains do not completely disappear from the Mexican Caribbean coast.
Dry season in Playa del Carmen: November to May
From November, precipitation and heat decrease significantly. The climate continues to improve in the following months. You will have several months to relax quietly on the beach and enjoy the pleasant warmth of the seawater for swimming. The sun is there for tanning.
Until the end of May, the conditions are ideal for unforgettable relaxation: fewer showers, beautiful sunny days, pleasant warmth as the sea breeze from the Caribbean tempers the heat, and above all a calm and tranquil sea for more enjoyment. This season corresponds to a non-cyclonic period, which unfortunately occupies a good part of the rest of the year.
Like Acapulco, located on the Pacific coast of Mexico, Playa del Carmen offers its visitors the opportunity to have fun both day and night. The nighttime temperature drops which affects the quality of atmospheric conditions, allowing you to dance in nightclubs while enjoying the mildness of the night.
Wet season in Playa del Carmen: June to October
The wet season in Playa del Carmen corresponds to the period between June and October. The significant increase in the intensity and frequency of showers is hard to miss. It is hot, both day and night, with daytime temperatures ranging from 27°C (81°F) to 32°C (90°F) and nighttime temperatures around 26°C (79°F) . So if you plan to stay in Playa del Carmen at this time of year, demand air-conditioned rooms that will allow you to feel comfortable.
The rains are abundant, but if there are no hurricanes or cyclones, they dissipate quickly. Moreover, showers usually occur in the morning or late afternoon, leaving you time to enjoy the mild weather in Playa del Carmen to engage in your favorite activities: swimming, diving, kite-surfing, or jet-skiing among other entertainment options offered to tourists. You can also take advantage of the proximity of Chichen Itza for cultural tourism.
Apart from the months of August, September, and October (and, to a lesser extent, June), which experience a high level of humidity and almost scorching heat, the rest of the wet season is recommended for a pleasant stay in the seaside resort of Playa del Carmen.

Charts: temperature and rainfall in Playa del Carmen
In the charts below, you can see the following seasonal norms for the city of Playa del Carmen: the minimum and maximum outdoor temperature, the risk and amount of monthly rainfall, daily average sunshine, sea temperature, and relative humidity for each month of the year.
Outside temperature
Precipitation (rainfall)
Daily sunshine hours
Sea temperature
Humidity
Peak visitor numbers and tourist seasons in Playa del Carmen
Find out when Playa del Carmen has its high tourist season (the period when the influx of tourists is highest) and off-peak tourist season using our data and figures.
Tourist seasons in Playa del Carmen
- Very low season in Playa del Carmen
The months with the lowest number of tourists are: May, June, September and October. - Low season in Playa del Carmen
The months with low numbers of tourists are: March, April, July, August and November. - High season in Playa del Carmen
The number of visitors to Playa del Carmen is high in: January and February. - Peak season in Playa del Carmen
The largest number of tourists visiting Playa del Carmen is during: December.
Figure: Visitor index for Playa del Carmen month by month
Best time for low prices in Playa del Carmen
Average prices of hotels in Playa del Carmen month by month
Generally, October is the month with the lowest hotel prices in Playa del Carmen. So this is a great time to save on your holiday! In contrast, December is statistically the most expensive month of the year for hotels.
Find the best price for your hotel room
Average price of hiring a car in Playa del Carmen
On average, it costs $ 34 per day to hire a car in Playa del Carmen. This price varies by $ 16 depending on the month. In september, hiring a car costs an average of $ 28 per 24 hours, so this is the best time to save money! In contrast, the average price in december is $ 43.
Other cities and places near Playa del Carmen

 Playa del Carmen
 other locations