Best time to go to Los Cabos Average weather of Los Cabos, Mexico
When is the best time to go to Los Cabos?
When is the best time to go to Los Cabos? Here's some information to help you in your decision:
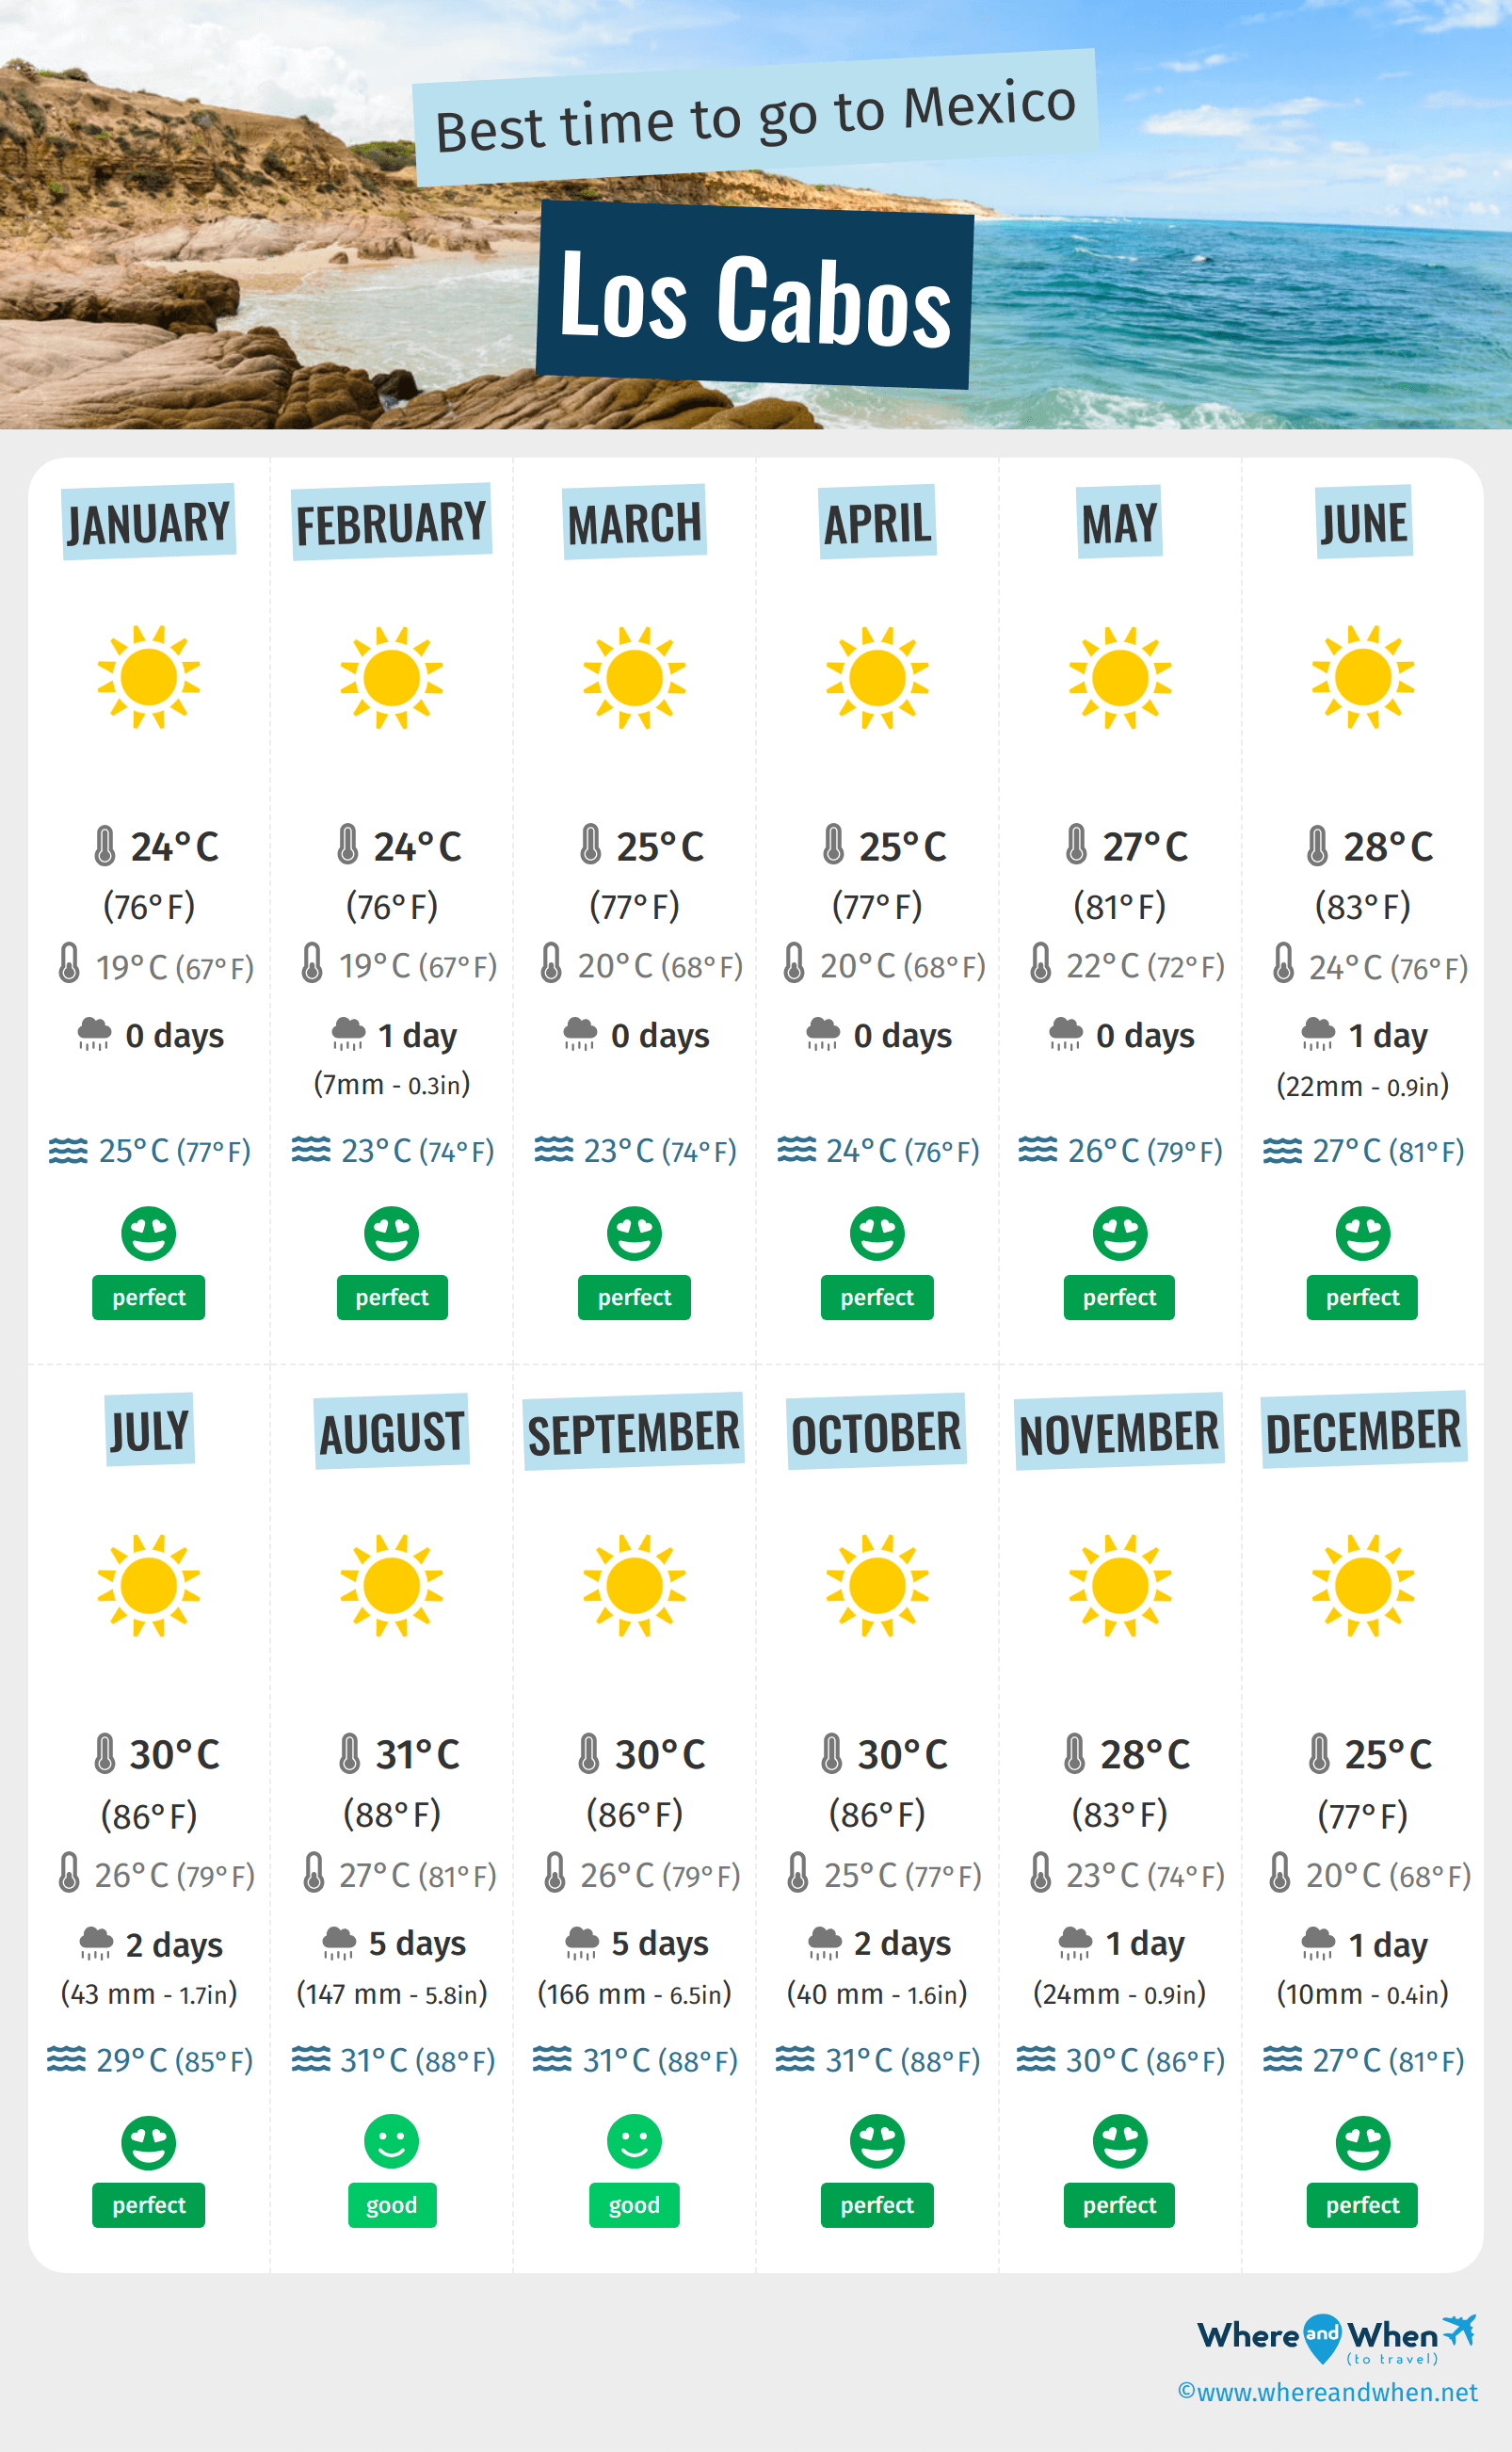
- The weather is good all year round in Los Cabos
- On average, the warmest months are June, July, August, September, October and November
- Los Cabos has dry periods in January, February, March, April, May and December
- The rainiest months are August and September
- The best months for swimming are August, September, October and November
Annual weather in Los Cabos
Weather details in Los Cabos month by month
Weather and climate in Los Cabos
- Between the months of january and june the climate is perfect. The record temperature this month is 88°F and, in june, 1 days of rain are expected.
- In july the climate is good. the thermometer goes up to 86°F°C and, in july, 2 days of rain are expected.
- Between the months of august and september the climate is correct. It is for example 86°F as maximum temperature in september and you can expect to have 6.5in of rainfall/month during this period.
- In the month of october the climate is favorable. The temperature rises to 86°F and, in october, 2 days of rain are expected.
- Between the months of november and december the climate is very good. The temperature rises to 77°F and it rains in december about 0.4in.

Charts: temperature and rainfall in Los Cabos
In the charts below, you can see the following seasonal norms for the city of Los Cabos: the minimum and maximum outdoor temperature, the risk and amount of monthly rainfall, daily average sunshine, sea temperature, and relative humidity for each month of the year.
Outside temperature
Precipitation (rainfall)
Daily sunshine hours
Sea temperature
Humidity
Peak visitor numbers and tourist seasons in Los Cabos
Find out when Los Cabos has its high tourist season (the period when the influx of tourists is highest) and off-peak tourist season using our data and figures.
Tourist seasons in Los Cabos
- Very low season in Los Cabos
The months with the lowest number of tourists are: September and October. - Low season in Los Cabos
The months with low numbers of tourists are: February, April, May, June, July, August and November. - High season in Los Cabos
The number of visitors to Los Cabos is high in: January and March. - Peak season in Los Cabos
The largest number of tourists visiting Los Cabos is during: December.
Figure: Visitor index for Los Cabos month by month
Best time for low prices in Los Cabos
Average prices of hotels in Los Cabos month by month
Generally, September is the month with the lowest hotel prices in Los Cabos. So this is a great time to save on your holiday! In contrast, March is statistically the most expensive month of the year for hotels.

Find the best price for your hotel room
Average price of hiring a car in Los Cabos
On average, it costs $ 39 per day to hire a car in Los Cabos. This price varies by $ 17 depending on the month. In may, hiring a car costs an average of $ 31 per 24 hours, so this is the best time to save money! In contrast, the average price in december is $ 47.
Other cities and places near Los Cabos


 Los Cabos
 other locations