Best time to go to Narmada Average weather of Narmada, Lombok
When is the best time to go to Narmada?
When is the best time to go to Narmada? Here's some information to help you in your decision:
- The best months for good weather in Narmada are May, June, July, August, September and October
- On average, it is hot all year round
- The rainiest months are January, February, November and December
Annual weather in Narmada
For full information about the climate and weather in Narmada a specific month, click on the corresponding line below:
| Month | Our opinion | ||||
|---|---|---|---|---|---|
| January | 81°F/85°F | bad weather | Narmada in january | ||
| February | 81°F/85°F | tolerable weather | Narmada in february | ||
| March | 83°F/86°F | tolerable weather | Narmada in march | ||
| April | 83°F/86°F | tolerable weather | Narmada in april | ||
| May | 83°F/86°F | good weather | Narmada in may | ||
| June | 81°F/85°F | good weather | Narmada in june | ||
| July | 79°F/85°F | perfect weather | Narmada in july | ||
| August | 79°F/85°F | perfect weather | Narmada in august | ||
| September | 79°F/85°F | perfect weather | Narmada in september | ||
| October | 81°F/86°F | good weather | Narmada in october | ||
| November | 83°F/86°F | tolerable weather | Narmada in november | ||
| December | 83°F/86°F | tolerable weather | Narmada in december |


Weather and climate in Narmada
Narmada enjoys a tropical savanna climate (with dry winter) in accordance with the Köppen-Geiger classification. The yearly average maximum temperature in Narmada is 86°F (ranging from 85°F in july to 86°F in november). Annual rainfall is 90in, with a minimum of 1.3in in august and a maximum of 14.2in in january.
- Between january and march the climate is very bad. It is for example 86°F as maximum temperature in march and it rains about 11.3in each month.
- Between april and may the climate is bad. In average, on the morning it is 83°F and you can expect to have 5.7in of rainfall/month during this period.
- From june to july the climate is okay. It is for example 85°F as maximum temperature in july and it rains about 9% of the time in july.
- Between the months of august and september the climate is good. At lunchtime, it's 85°F in average and it rains about 11% of the time in september.
- In october the climate is just OK. It is for example 86°F as maximum temperature in october and it rains about 23% of the time in october.
- In the month of november the climate is not good. At lunchtime, it's 86°F in average and it rains in november about 11.7in.
- In december the climate is very bad. By early evening, the temperature averages 81°F and it rains in december about 13.5in.
Charts: temperature and rainfall in Narmada
In the charts below, you can see the following seasonal norms for the city of Narmada: the minimum and maximum outdoor temperature, the risk and amount of monthly rainfall, daily average sunshine, sea temperature, and relative humidity for each month of the year.
Outside temperature
Precipitation (rainfall)
Daily sunshine hours
Sea temperature
Humidity
Other cities and places near Narmada


Chargement en cours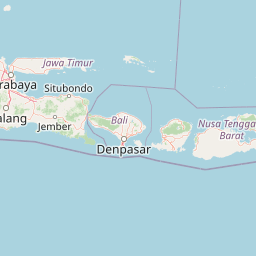
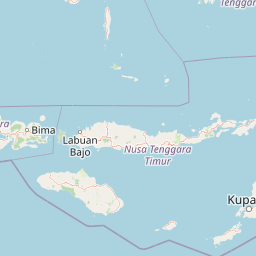
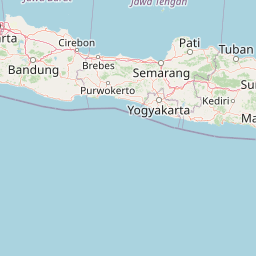


Leaflet | © OpenStreetMap contributors
Legend:
 Narmada
 other locations
Narmada
other locations