Best time to go to Mexico City Average weather of Mexico City, Mexico
When is the best time to go to Mexico City?
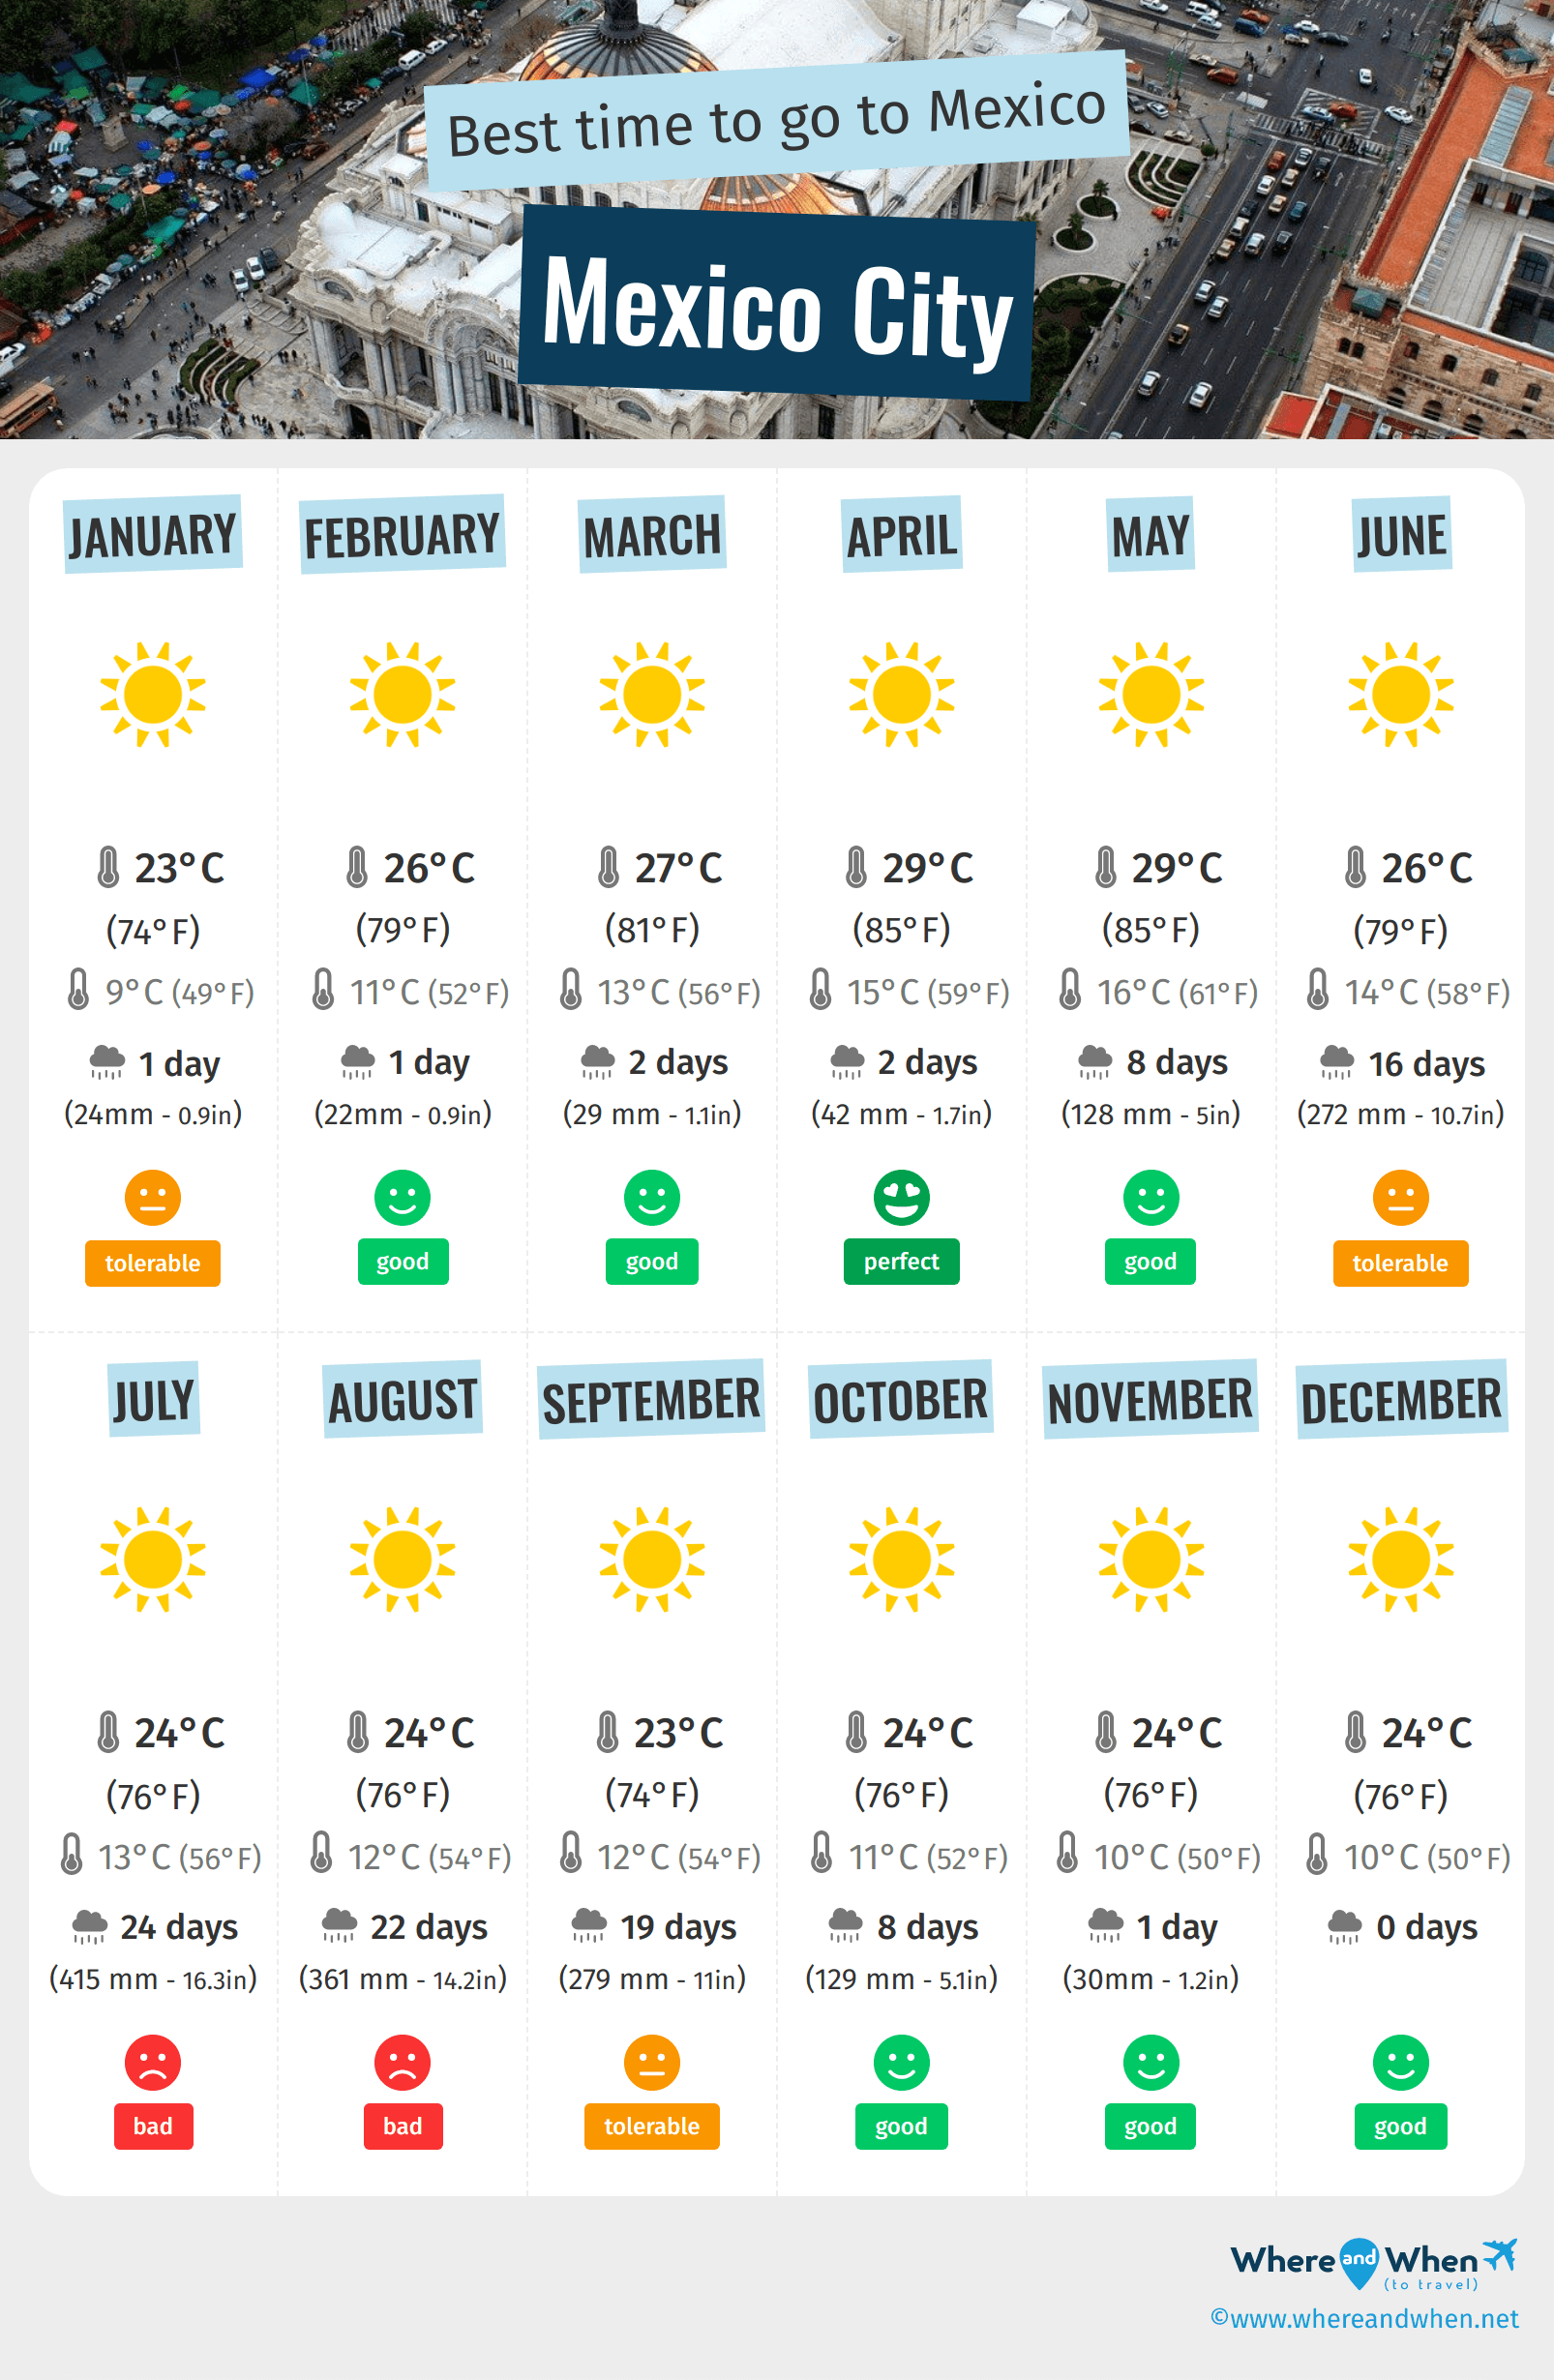
The best time to discover the wonders of Mexico depends on several factors. If we consider the weather, the ideal period for a visit extends from February to May and from October to December. During these months, the climate is pleasant, offering a perfect balance between mild temperatures and low precipitation. It is the perfect time to explore the city without being bothered by rain or too intense sunlight.
If you are wondering when to go to Mexico to enjoy a lively atmosphere, you should rather aim for the peak tourist season which is in October, November, and December. These months correspond to a higher influx of visitors from around the world. The atmosphere is festive and tourist attractions, although more crowded, are particularly lively.
To better understand the Mexican view of death, visit Mexico during the celebration of Día de los Muertos (Day of the Dead), which takes place on November 2nd.
However, visiting Mexico during less favorable periods can also have advantages. The rainy season, from May to October, although marked by more frequent showers, offers lush vegetation and landscapes of renewed beauty. The months of July and August, although rainy, are also the hottest, making the evenings particularly pleasant.
Finally, remember that each time of the year offers unique activities and experiences. Whether you want to attend traditional festivals, discover local cuisine, or explore historical sites, Mexico always has something to offer. You just need to prepare your trip well and adapt to the weather to make the most of your stay in this fascinating city.
So, when is the best time to go to Mexico City? Here's some more information to help you in your decision:
- The best months for good weather in Mexico City are February, March, April, May, October, November and December
- On average, the warmest months are March, April, May and June
- December is the driest month
- The coldest months are January, November and December
- The rainiest months are July and August
Annual weather in Mexico City
Weather details in Mexico City month by month
Weather and climate in Mexico City
Welcome to Mexico, the capital of Mexico. Planning a trip here requires a good understanding of the city's climate. Mexico is characterized by an oceanic climate, which is a type of temperate climate. More specifically, according to the Köppen-Geiger classification, it is a subtropical highland climate with a dry winter and temperate summer. The city experiences two main seasons: a rainy season between May and October and a dry season between November and April.
Mexico Climate: Dry Season (November to April)
The dry season in Mexico extends from November to April. During this period, precipitation is scarce and the sky is generally clear, providing an average of 10 to 12 hours of sunshine per day. Daytime temperatures typically range between 10°C (50°F) and 26°C (79°F) , with relative humidity measured around 70% to 80%. January and February are considered the coldest months, with minimum temperatures dropping to 9°C (49°F) .
Mexico Climate: Rainy Season (May to October)
The rainy season in Mexico starts in May and ends in October. During this period, the city experiences more frequent showers, especially between June and September. Daytime temperatures remain relatively stable, ranging between 12°C (54°F) and 29°C (85°F) , and humidity can reach 89%. July is usually the rainiest month, with an average of 24 rainy days and a total of 415mm of precipitation. Despite the rain, the city still enjoys a good amount of sunshine, with an average of 11 to 13 hours of sunshine per day.
In conclusion, Mexico's climate offers a diversity of weather conditions throughout the year. Whether you plan to visit during the dry season or the rainy season, you can expect pleasant temperatures and good sunshine. Just make sure to check the weather forecast before you go and prepare accordingly.

Charts: temperature and rainfall in Mexico City
In the charts below, you can see the following seasonal norms for the city of Mexico City: the minimum and maximum outdoor temperature, the risk and amount of monthly rainfall, daily average sunshine, and relative humidity for each month of the year.
Outside temperature
Precipitation (rainfall)
Daily sunshine hours
Humidity
Peak visitor numbers and tourist seasons in Mexico City
Find out when Mexico City has its high tourist season (the period when the influx of tourists is highest) and off-peak tourist season using our data and figures.
Tourist seasons in Mexico City
- Very low season in Mexico City
The months with the lowest number of tourists are: January, February, March, May and June. - Low season in Mexico City
The months with low numbers of tourists are: April, July, August and September. - Peak season in Mexico City
The largest number of tourists visiting Mexico City is during: October, November and December.
Figure: Visitor index for Mexico City month by month
Best time for low prices in Mexico City
Average prices of hotels in Mexico City month by month
Generally, July is the month with the lowest hotel prices in Mexico City. So this is a great time to save on your holiday! In contrast, October is statistically the most expensive month of the year for hotels.
Find the best price for your hotel room
Average price for flights to Mexico City
A return flight between London and Mexico City is generally cheaper if you go in february ($ 922 on average): this is the best time for travellers on a tight budget. In contrast, you may end up paying $ 597 more for your airline ticket to Mexico City if you go in august.
Find the best price for your flight
Average price of hiring a car in Mexico City
On average, it costs $ 39 per day to hire a car in Mexico City. This price varies by $ 7.8 depending on the month. In may, hiring a car costs an average of $ 34 per 24 hours, so this is the best time to save money! In contrast, the average price in august is $ 42.
Other cities and places near Mexico City


 Mexico City
 other locations