Best time to go to Yaounde Average weather of Yaounde, Cameroon
When is the best time to go to Yaounde?
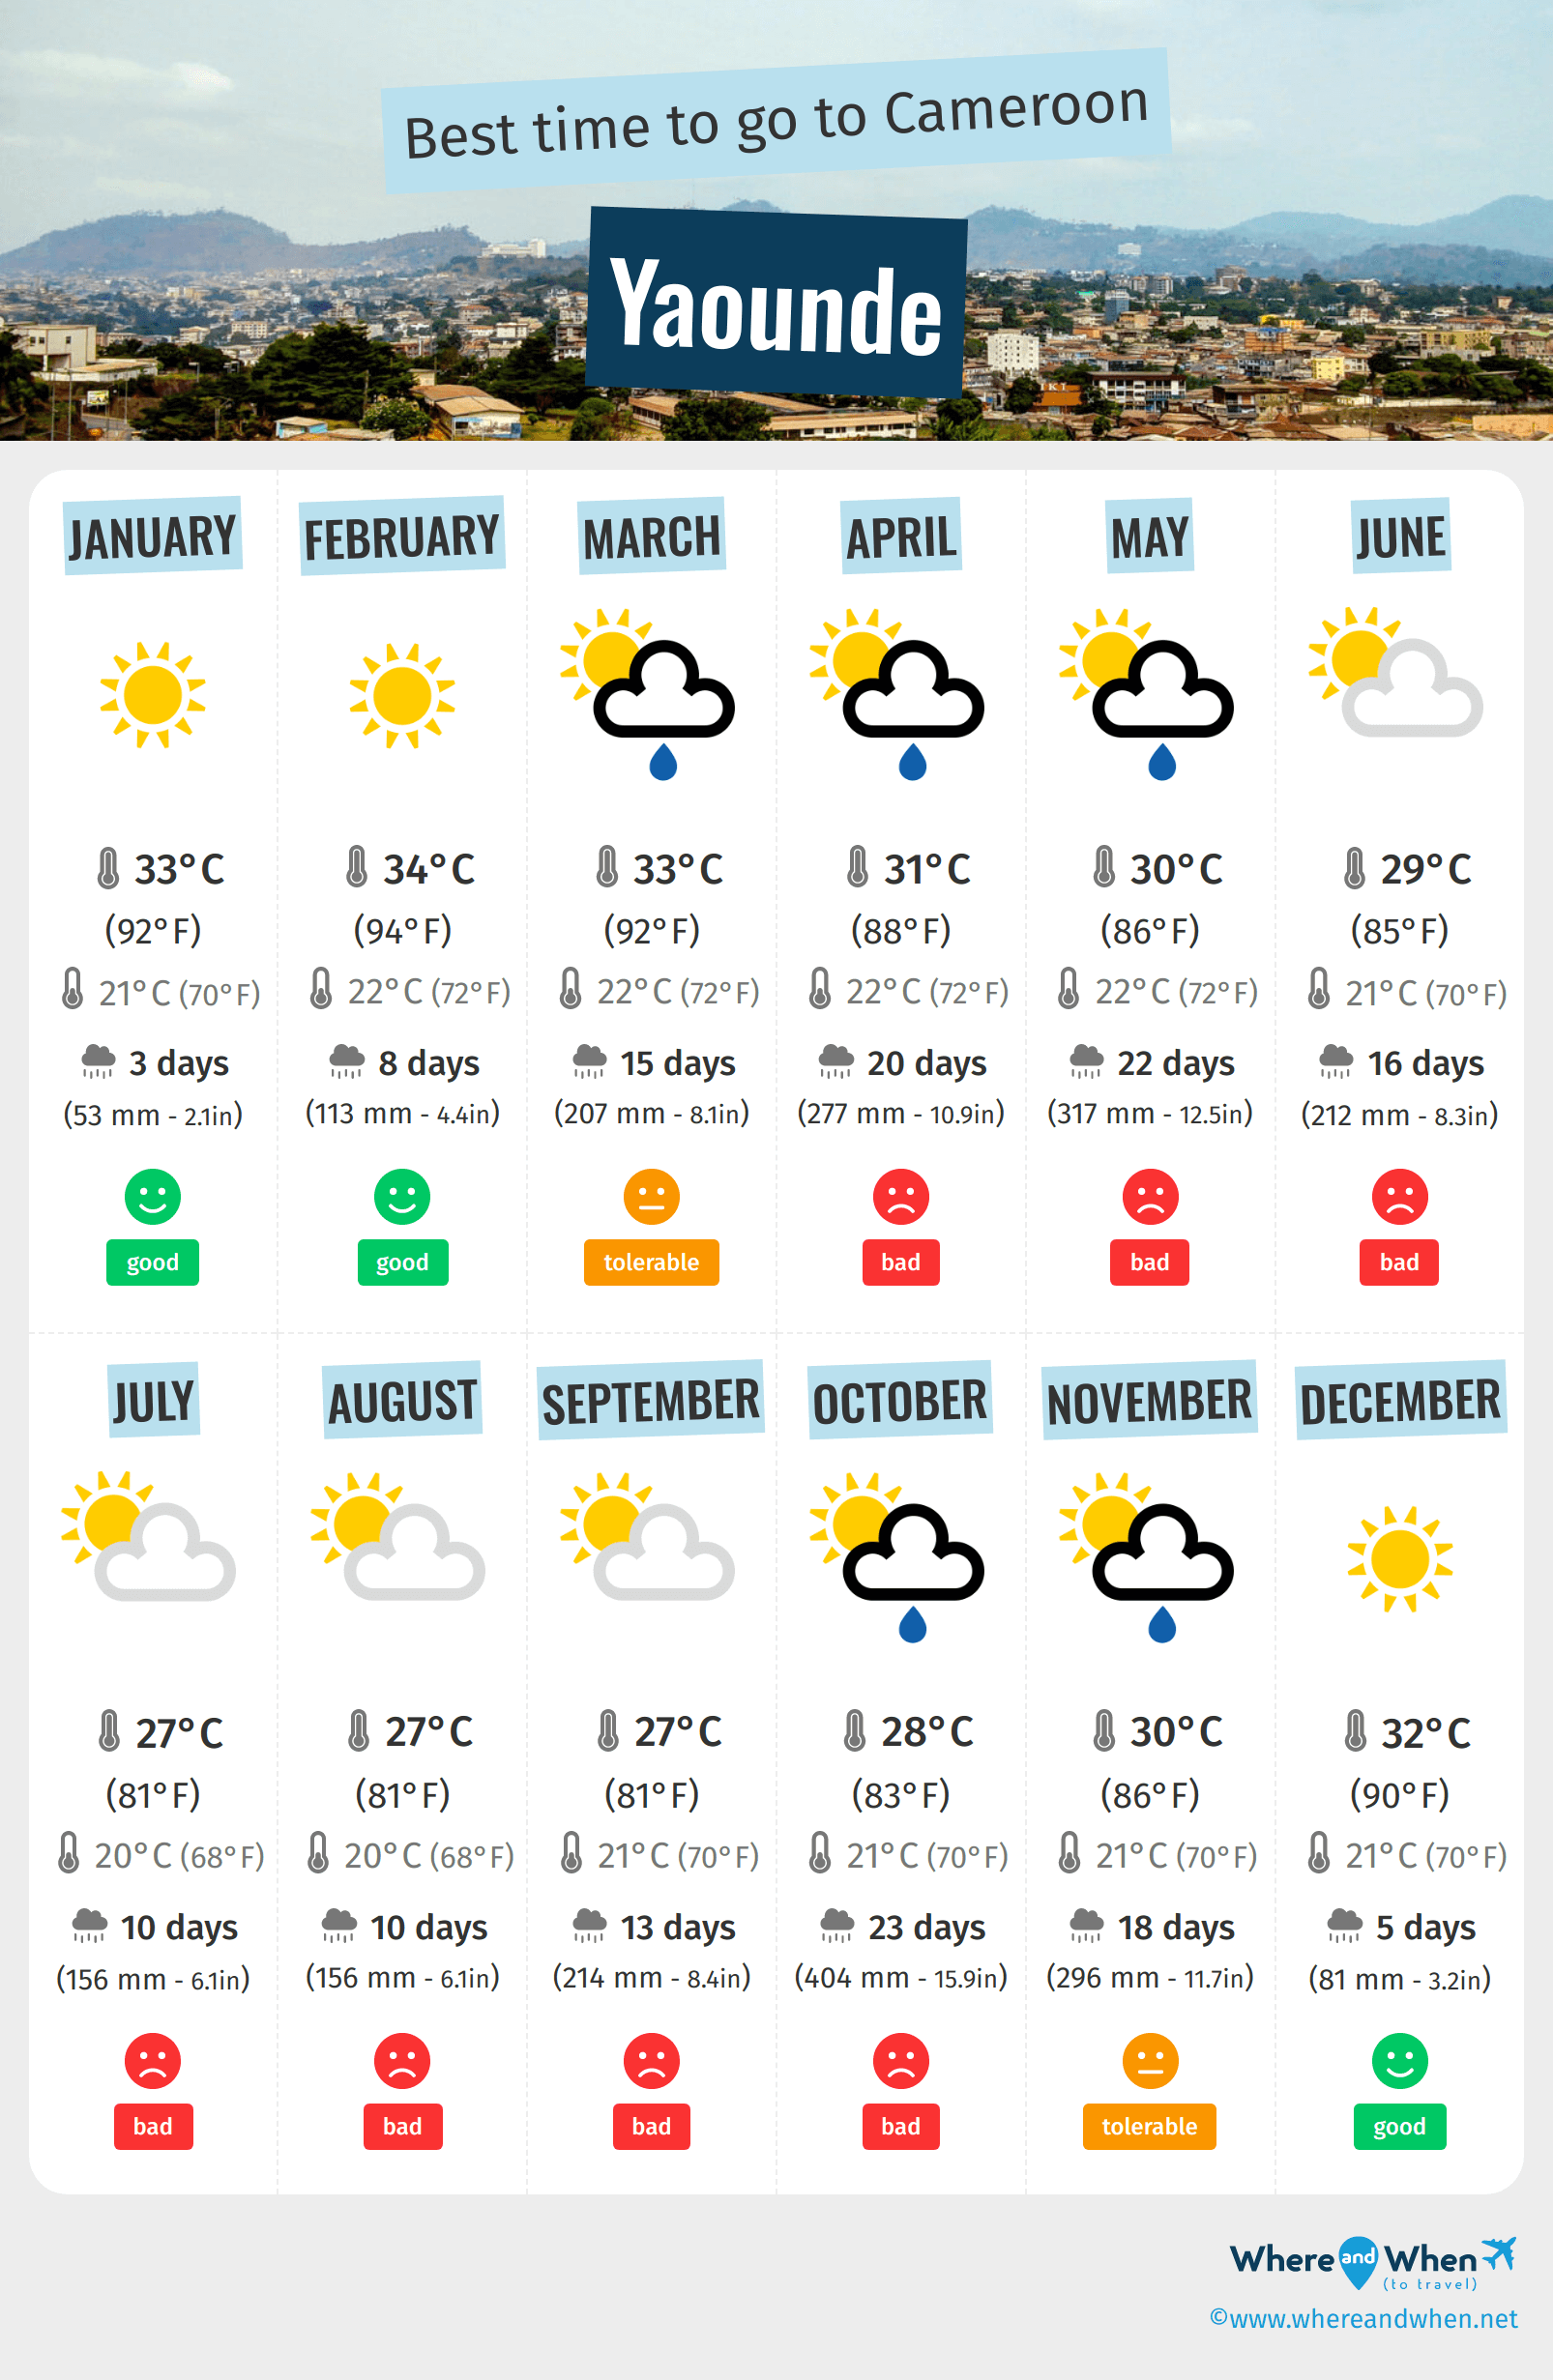
The best time to visit Yaoundé and enjoy pleasant weather is in December, January, and February. These months offer pleasant meteorological conditions, with mild temperatures and low rainfall, ideal for exploring the city and its surroundings. However, the months of November and March, although a bit rainy, can also be considered.
It is important to note that the peak tourist season in Yaoundé extends over the months of August, November, and December. If you choose to visit the city during this period, expect larger crowds, especially at major tourist sites. However, this season has the advantage of offering a festive and dynamic atmosphere, with many cultural and tourist events scheduled.
If you are wondering when to visit Yaoundé and want to avoid crowds, consider planning your trip outside the peak tourist season. For example, the months of January and February offer favorable weather conditions and fewer tourists.
Finally, although the rainy season, from June to October, is generally less conducive to tourism due to more frequent rainfall, it also offers lush landscapes and a unique atmosphere. For adventurous and flexible travelers, this is a period to consider for a different travel experience.
Regardless of the time you choose, Yaoundé will charm you with its cultural richness, diverse landscapes, and warm hospitality.
So, when is the best time to go to Yaounde? Here's some more information to help you in your decision:
- The best months for good weather in Yaounde are January, February and December
- On average, the warmest months are January, February, March, April and December
- October is the rainiest month
Annual weather in Yaounde
Weather details in Yaounde month by month
Weather and climate in Yaounde
Yaoundé, the capital of Cameroon, is characterized by a tropical climate, of the savanna type with a dry winter (Aw) according to the Köppen-Geiger classification. This means that the city experiences two main seasons: a dry season and a wet season, each with its own characteristics in terms of temperature and precipitation.
The dry season in Yaoundé (November - March)
The dry season lasts from November to March. This period is characterized by fairly high temperatures, ranging from 21°C (70°F) to 34°C (94°F) . The months of January and February are the most favorable, with an average temperature of 27°C (81°F) in the morning, which can rise to 33°C (92°F) at midday. The sky is generally clear or sunny, with a few rainy days.
The transition to the wet season in Yaoundé (April - May)
From April onwards, the climate begins to change, marking the transition to the wet season. Temperatures remain quite warm, but precipitation gradually increases. In May, for example, there is a significant increase in rainy days, with an average temperature slightly decreasing, ranging between 22°C (72°F) and 30°C (86°F) .
The wet season in Yaoundé (June - October)
The wet season lasts from June to October. This period is characterized by cooler temperatures and abundant rainfall. The month of October is the wettest, with temperatures ranging between 21°C (70°F) and 28°C (83°F) and the highest number of rainy days.
In conclusion, Yaoundé offers a tropical climate with a dry season, ideal for tourist activities, between November and March, and a wet season, cooler and rainier, between June and October. It is therefore recommended to plan your trip according to these seasons to make the most of what the city has to offer. The months of January and February are particularly recommended for their favorable climate.

Charts: temperature and rainfall in Yaounde
In the charts below, you can see the following seasonal norms for the city of Yaounde: the minimum and maximum outdoor temperature, the risk and amount of monthly rainfall, daily average sunshine, and relative humidity for each month of the year.
Outside temperature
Precipitation (rainfall)
Daily sunshine hours
Humidity
Peak visitor numbers and tourist seasons in Yaounde
Find out when Yaounde has its high tourist season (the period when the influx of tourists is highest) and off-peak tourist season using our data and figures.
Tourist seasons in Yaounde
- Very low season in Yaounde
The months with the lowest number of tourists are: March, April, May and June. - Low season in Yaounde
The months with low numbers of tourists are: January, February, July, September and October. - High season in Yaounde
The number of visitors to Yaounde is high in: August and November. - Peak season in Yaounde
The largest number of tourists visiting Yaounde is during: December.
Figure: Visitor index for Yaounde month by month
Best time for low prices in Yaounde
Average prices of hotels in Yaounde month by month
Generally, October is the month with the lowest hotel prices in Yaounde. So this is a great time to save on your holiday! In contrast, June is statistically the most expensive month of the year for hotels.

Find the best price for your hotel room
Average price for flights to Yaounde
A return flight between London and Yaounde is generally cheaper if you go in march ($ 777 on average): this is the best time for travellers on a tight budget. In contrast, you may end up paying $ 580 more for your airline ticket to Yaounde if you go in august.
Other cities and places near Yaounde


 Yaounde
 other locations