Panama City in october: average Weather, Temperature and Climate
Weather in Panama City in october 2025
The weather in Panama City in october comes from statistical datas on the past years. You can view the weather statistics the entire month, but also by using the tabs for the beginning, the middle and the end of the month.
Average weather throughout october
bad weather UV index: 7
Weather at 6am
77°F
 Partly Cloudy
47% of time

16%

14%

10%
Weather at 12pm
85°F
 Moderate rain at times
40% of time

32%

15%
11%
Weather at 6pm
79°F
 Heavy rain
52% of time
25%
13%
7%
Weather at 3am
77°F

40%

22%

13%

11%
Evolution of daily average temperature and precipitation in Panama City in october
These charts show the evolution of average minimum/maximum temperatures as well as average daily precipitation volume in Panama City in october.
The climate of Panama City in october is bad
In october in Panama City, the climate is wet (with 16.2in of rainfall over 21 days). The situation is deteriorating compared to the previous month since in september there is an average of 13.9in of rainfall over 19 days.
The climate enjoyable in that locality the month of october. The high seasonal norm is 86°F. The seasonal minimum is 77°F. Thus, the mean temperature average in october in Panama City is 81°F. Note that seasonal normals are in contrast with those observed in Panama City in october with a maximum record of 92°F in 2015 and a minimum record of 72°F in 2011. You can plan to have about 10 days with temperatures up to 86°F, or 32 of the month.
On average, in Panama City, the days of october last 11:55. Sunrise is at 06:06 and sunset is at 18:01.
October: another location in Panama?
If you want to go to Panama in october, there are destinations with better weather than Panama City:
In october, Bocas Del Toro, Colón, San Blas Islands and El Porvenir have a tolerable climate, but better than Panama City.
Seasonal average climate and temperature of Panama City in october
Check below seasonal norms These datas are compiled from the weather statements earlier years of october.
| October | |||||
| Outside temperature | |||||
| Average temperature | 81°F | ||||
| Highest temperature | 86°F | ||||
| Lowest temperature | 77°F | ||||
| Highest record temperature | 92°F (2015) | ||||
| Lowest record temperature | 72°F (2011) | ||||
| Number of days at +86°F | 10 day(s) (32%) | ||||
| Number of days at +65°F | 31 day(s) (100%) | ||||
| Sea temperature | |||||
| Average sea temperature | 84°F | ||||
| Lowest sea temperature | 82°F | ||||
| Highest sea temperature | 85°F | ||||
| Wind | |||||
| Wind speed | 11km/h | ||||
| Wind temperature | 77°F | ||||
| Precipitation (rainfall) | |||||
| Rainfall | 16.2in | ||||
| Number of days with rainfall | 21 day(s) (68%) | ||||
| Record daily rainfall | 2.8in (2015) | ||||
| Other climate data | |||||
| Humidity | 91% | ||||
| Visibility | 8.47km | ||||
| Cloud cover | 47% | ||||
| UV index | 7 | ||||
| Daily sunshine hours | 10 | ||||
| Sunrise and sunset | |||||
| Time of sunrise | 06:06 | ||||
| Time of sunset | 18:01 | ||||
| Length of day | 11:55 | ||||
| Our opinion about the weather in october | |||||
| Our opinion at whereandwhen.net | bad | ||||
How was the weather last october?
Here is the day by day recorded weather in Panama City in october 2024:

76°F to 86°F

76°F to 88°F
76°F to 86°F
76°F to 85°F
76°F to 86°F
76°F to 86°F
77°F to 86°F
77°F to 86°F
77°F to 83°F

76°F to 83°F
77°F to 81°F
76°F to 85°F
77°F to 83°F
77°F to 79°F
76°F to 79°F
76°F to 85°F
76°F to 83°F

77°F to 83°F
77°F to 83°F
79°F to 83°F
77°F to 83°F
76°F to 83°F
76°F to 83°F
77°F to 83°F
77°F to 85°F
77°F to 83°F
79°F to 81°F
79°F to 83°F
77°F to 79°F
76°F to 77°F
76°F to 81°F
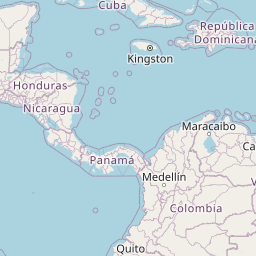
Map: other cities in Panama in october
Cities near Panama City:
| San Miguelito in october | bad weather |
| Arraijan in october | bad weather |
| Taboga island in october | bad weather |
| Gamboa in october | bad weather |
| La Chorrera in october | bad weather |
| Colón in october | tolerable weather |
| Chame in october | bad weather |
| Contadora island in october | bad weather |
| El Porvenir in october | tolerable weather |
| Hicacos Peninsula in october | bad weather |
| San Blas Islands in october | tolerable weather |
| Anton in october | bad weather |
Click over cities on the map for information about the weather in october.


 Panama City
 perfect weather
 good
good
 tolerable
 bad
bad
 very bad
Weather data for Panama City in october:
Weather data for Panama City for october are derived from an average of the weather forecast since 2009 in Panama City. There is a margin of error and these forecasts are to be considered as general information only. The weather in Panama City can vary slightly from year to year, but this data should limit surprises. So you can pack your bags or check for the best time in year to go to Panama City.