Panama in october: average Weather, Temperature and Climate, Where to go?
Weather in Panama in october 2025
In this section, find the the weather forecast for the month of october for most popular cities in Panama. These predictions are statistics for october from weather reports for many years. The percentage indicates the possibility of having the weather mentioned.
Average weather in october in Panama City
bad weather UV index: 7
Weather at 6am
77°F
 Partly Cloudy
47% of time

16%

14%

10%
Weather at 12pm
85°F
 Moderate rain at times
40% of time

32%

15%
11%
Weather at 6pm
79°F
 Heavy rain
52% of time
25%
13%
7%
Weather at 3am
77°F

40%

22%

13%

11%
More information about the weather in Panama City in october
Where to go in Panama in october?
Where to go in Panama in october: destination map
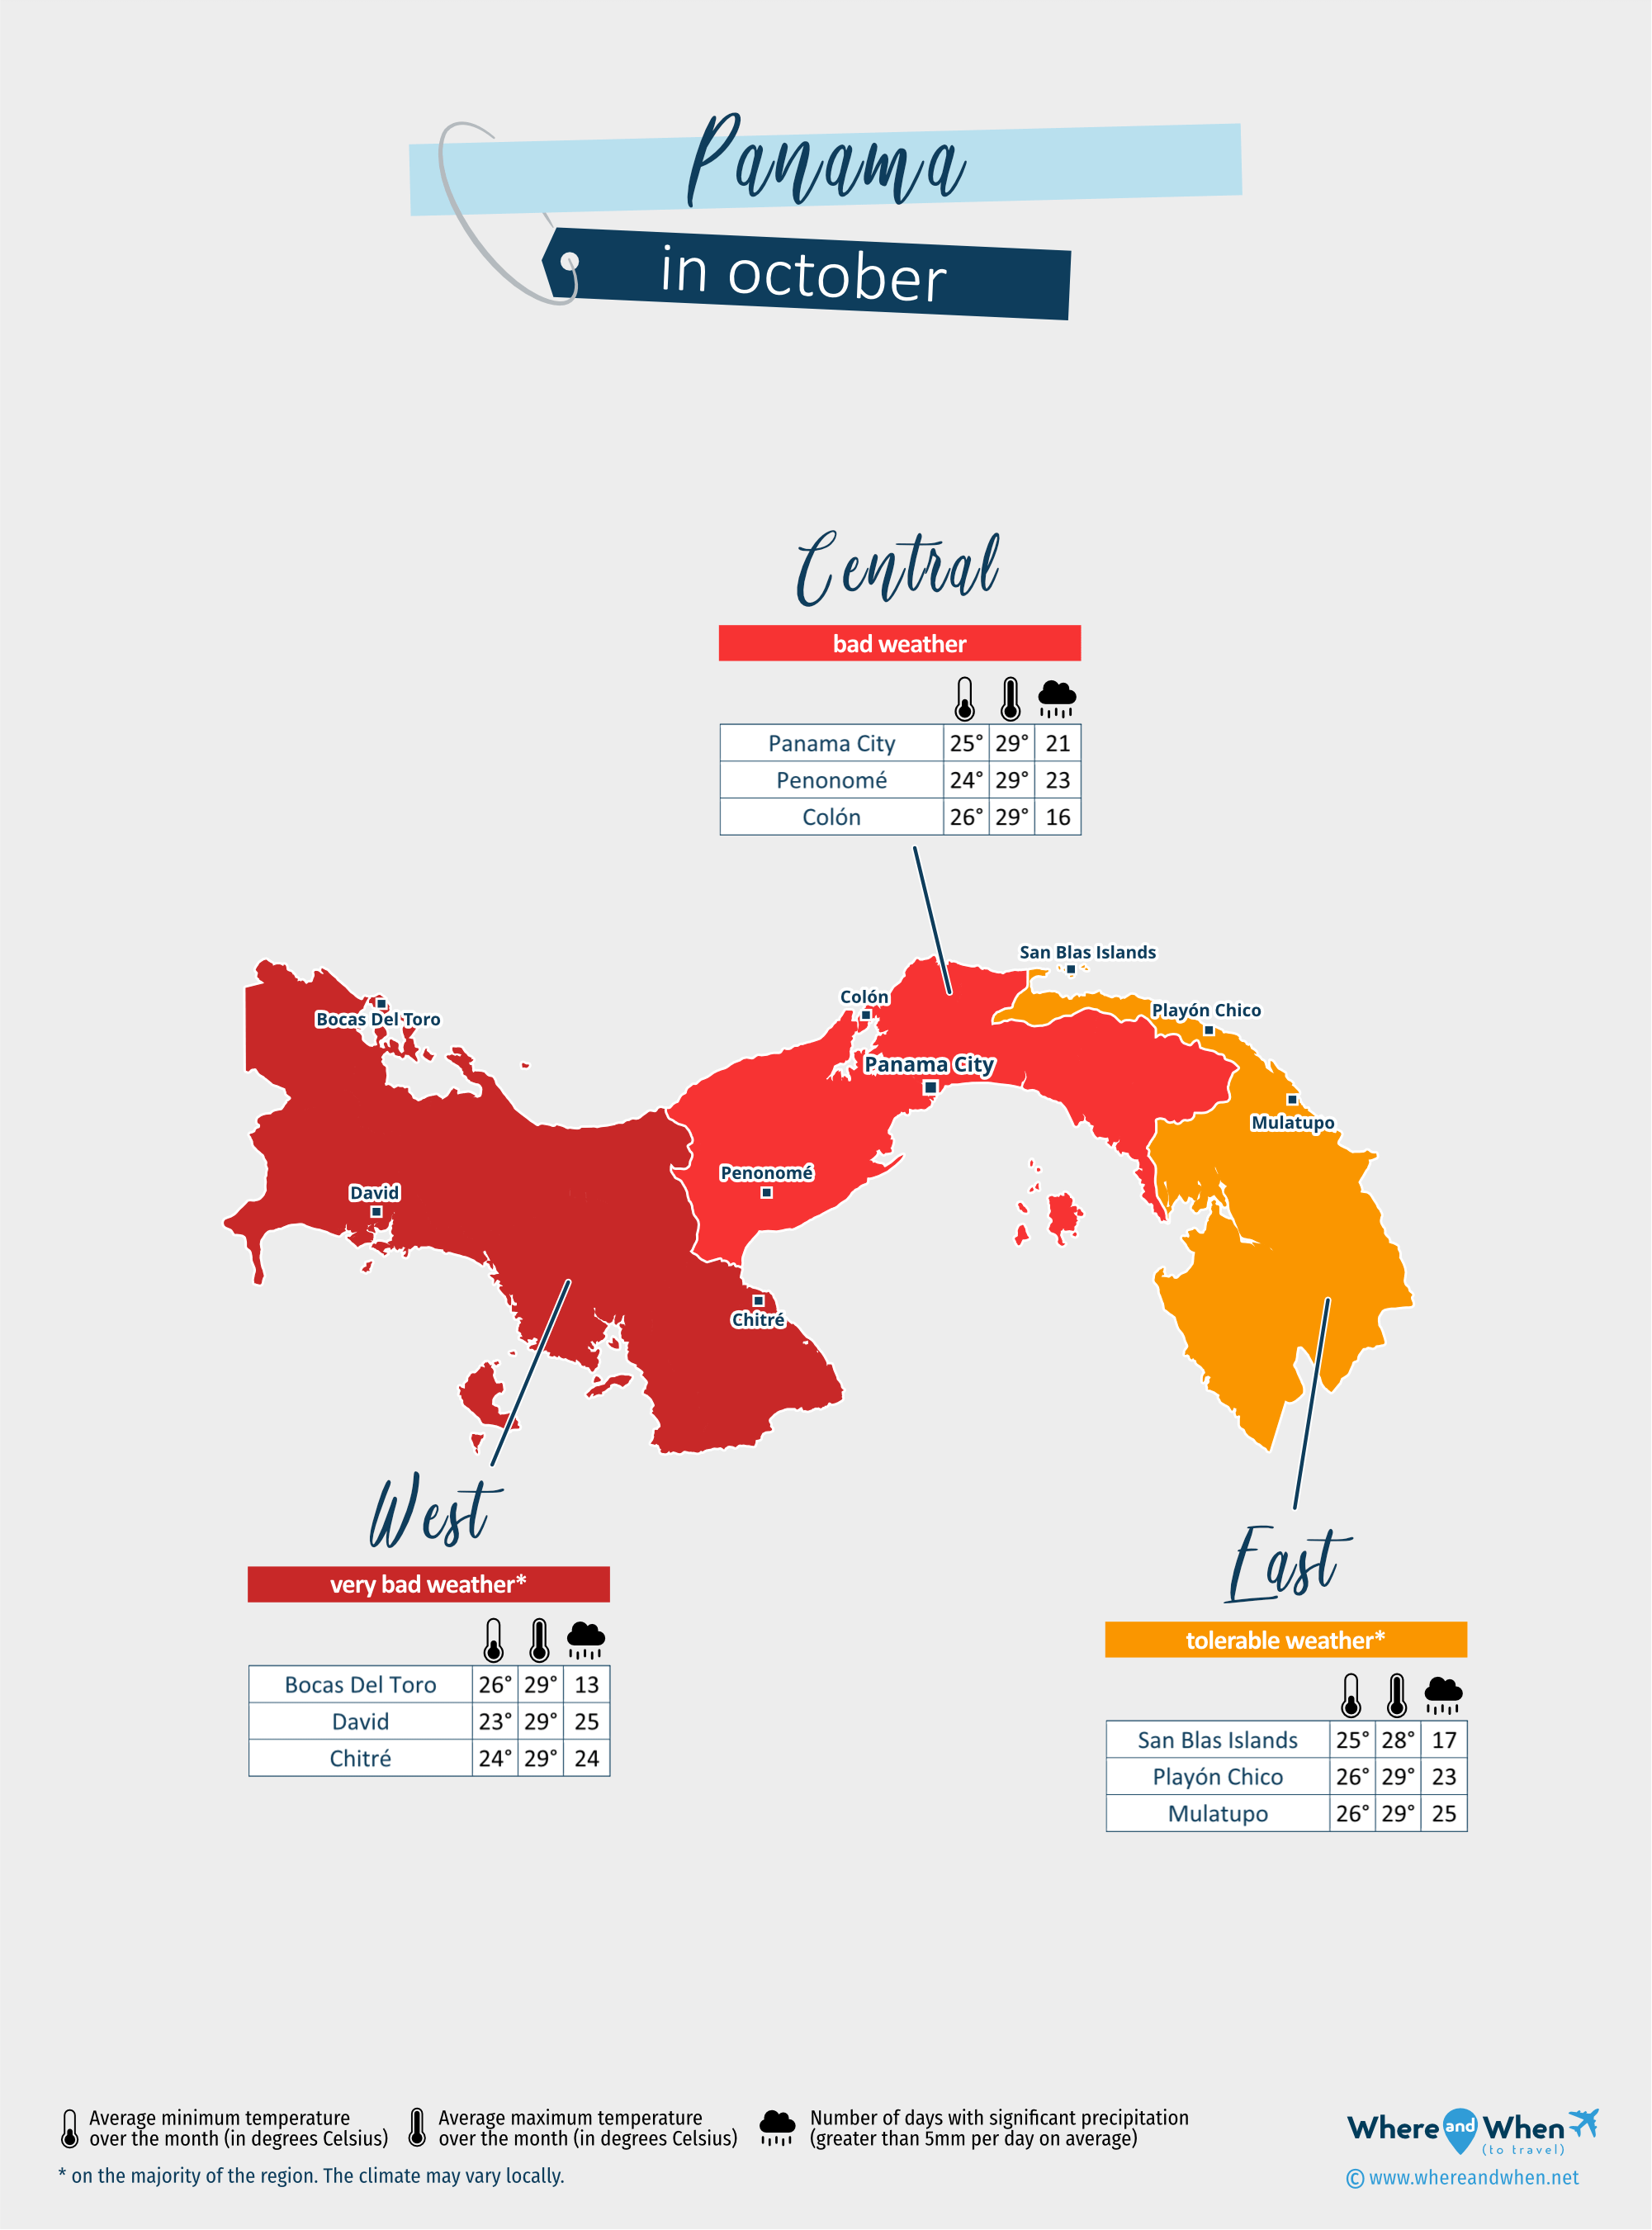
Where to go in each region in october?
| Central of Panama (Panama City, Penonomé, Colón...) | 85°F to 86°F | 16 à 24 days | 83°F to 86°F | bad weather |
| East of Panama (San Blas Islands, Playón Chico, Mulatupo...) | 85°F | 17 à 25 days | 85°F to 86°F | tolerable weather* |
| West of Panama (Bocas Del Toro, David, Chitré...) | 77°F to 86°F | 13 à 27 days | 83°F to 86°F | very bad weather* |
Where should you go in Panama in october when it comes to the weather?
Remember:
The climate in Panama in october ranges from tolerable to very bad depending on the region and city.
That month is not the best month to go to in Panama. The weather in Bocas Del Toro is quite correct. The sun is not there all the time and you risk you to be soaked by rain regularly. However, if you don't plan a pool and sun trip but rather cultural visits, this climate may be good enough for you. In addition, there are definitely fewer tourists dyring this month of october.
But it gets worse: in Hicaco Island, El Porvenir, Anton, San Blas Islands, Los Santos (Las Tablas), Gamboa, Taboga island, Boquete, Contadora island and Panama City and surrounding areas where the climate is very bad. It is really not advisable to go to these areas this month.
Climate in Panama in october
Climate in Panama City in october
In the month of october, maximum temperature is 86°F and minimum temperature is 77°F (for an average temperature of 81°F). The climate quite pleasant in this location in this month. With 16.2in over 21 days, rain is to be feared for your trip. Consider to pack adapted clothes.
| October | |||
| Average temperature | 81°F | ||
| Highest temperature | 86°F | ||
| Lowest temperature | 77°F | ||
| Sea temperature | 84°F | ||
| Rainfall | 16.2in | ||
| Number of days with rainfall | 21 day(s) (68%) | ||
| Humidity | 91% | ||
| Daily sunshine hours | 10 | ||
| Cloud cover | 47% | ||
| Length of day | 11:55 | ||
| Our opinion at whereandwhen.net | bad |
Climate in Bocas Del Toro in october
In the month of october, maximum temperature is 85°F and minimum temperature is 79°F (for an average temperature of 83°F). The climate is very hot in this city in the month of october. With 7.8in over 13 days, rainfall can happen for your stay. But this is pretty reasonably and it will not be continuous.
With a correct climate, the month of october is okay (but not good month) for traveling in that area.
| October | |||
| Average temperature | 83°F | ||
| Highest temperature | 85°F | ||
| Lowest temperature | 79°F | ||
| Sea temperature | 85°F | ||
| Rainfall | 7.8in | ||
| Number of days with rainfall | 13 day(s) (42%) | ||
| Humidity | 76% | ||
| Daily sunshine hours | 11 | ||
| Cloud cover | 34% | ||
| Length of day | 11:55 | ||
| Our opinion at whereandwhen.net | tolerable |
Climate in Chitré in october
In october, the mean temperature in Chitré is 81°F (maximum temperature is 86°F and minimum temperature is 77°F). The climate is burning in that area in this month. With 14.7in over 24 days, the weather is rather to rain throughout your holidays. Consider to pack adapted clothes.
| October | |||
| Average temperature | 81°F | ||
| Highest temperature | 86°F | ||
| Lowest temperature | 77°F | ||
| Sea temperature | 83°F | ||
| Rainfall | 14.7in | ||
| Number of days with rainfall | 24 day(s) (76%) | ||
| Humidity | 92% | ||
| Daily sunshine hours | 11 | ||
| Cloud cover | 46% | ||
| Length of day | 11:57 | ||
| Our opinion at whereandwhen.net | bad |
Climate in Colón in october
In the month of october, maximum temperature is 85°F and minimum temperature is 79°F (for an average temperature of 83°F). The climate is burning around this city in october. With 8.5in over 16 days, you risk getting wet slightly throughout your stay. But this is pretty reasonably and you will not be too bothered by it.
| October | |||
| Average temperature | 83°F | ||
| Highest temperature | 85°F | ||
| Lowest temperature | 79°F | ||
| Sea temperature | 85°F | ||
| Rainfall | 8.5in | ||
| Number of days with rainfall | 16 day(s) (53%) | ||
| Humidity | 88% | ||
| Daily sunshine hours | 10 | ||
| Cloud cover | 45% | ||
| Length of day | 11:55 | ||
| Our opinion at whereandwhen.net | tolerable |
Climate in David in october
In october, maximum temperature is 85°F and minimum temperature is 76°F (for an average temperature of 79°F). The climate is burning in this city in this month. With 21.3in over 25 days, you may find yourself often in the rain throughout your holidays. Consider to bring Rain coats.
| October | |||
| Average temperature | 79°F | ||
| Highest temperature | 85°F | ||
| Lowest temperature | 76°F | ||
| Sea temperature | 83°F | ||
| Rainfall | 21.3in | ||
| Number of days with rainfall | 25 day(s) (80%) | ||
| Humidity | 88% | ||
| Daily sunshine hours | 11 | ||
| Cloud cover | 46% | ||
| Length of day | 11:56 | ||
| Our opinion at whereandwhen.net | very bad |
All cities in Panama in october
| Panama City in october | bad weather |
| Bocas Del Toro in october | tolerable weather |
| Chitré in october | bad weather |
| Colón in october | tolerable weather |
| David in october | very bad weather |
| San Blas Islands in october | tolerable weather |
| Mulatupo in october | bad weather |
| Penonomé in october | bad weather |
| Playón Chico in october | bad weather |
| Anton in october | bad weather |
| Boquete in october | bad weather |
| El Porvenir in october | tolerable weather |
| Gamboa in october | bad weather |
| Contadora island in october | bad weather |
| Taboga island in october | bad weather |
| Los Santos (Las Tablas) in october | bad weather |
| Hicacos Peninsula in october | bad weather |
| Aguadulce in october | bad weather |
| Arraijan in october | bad weather |
| Buabidi in october | very bad weather |
| Chame in october | bad weather |
| Chiriqui in october | very bad weather |
| Cocle in october | bad weather |
| Dolega District in october | very bad weather |
| La Chorrera in october | bad weather |
| San Miguelito in october | bad weather |
| Soná in october | very bad weather |
Weather data for Panama in october:
Weather data for Panama in october is derived from an average of the weather forecast since 2009 in Panama. There is a margin of error and these forecasts are to be considered as general information only. The weather in Panama can vary slightly from year to year, but these predictions should limit surprises. So you can pack your bags and check when is the best time to go to Panama.