Best time to go to Koh Rong Average weather of Koh Rong, Cambodia
When is the best time to go to Koh Rong?
When is the best time to go to Koh Rong? Here's some information to help you in your decision:
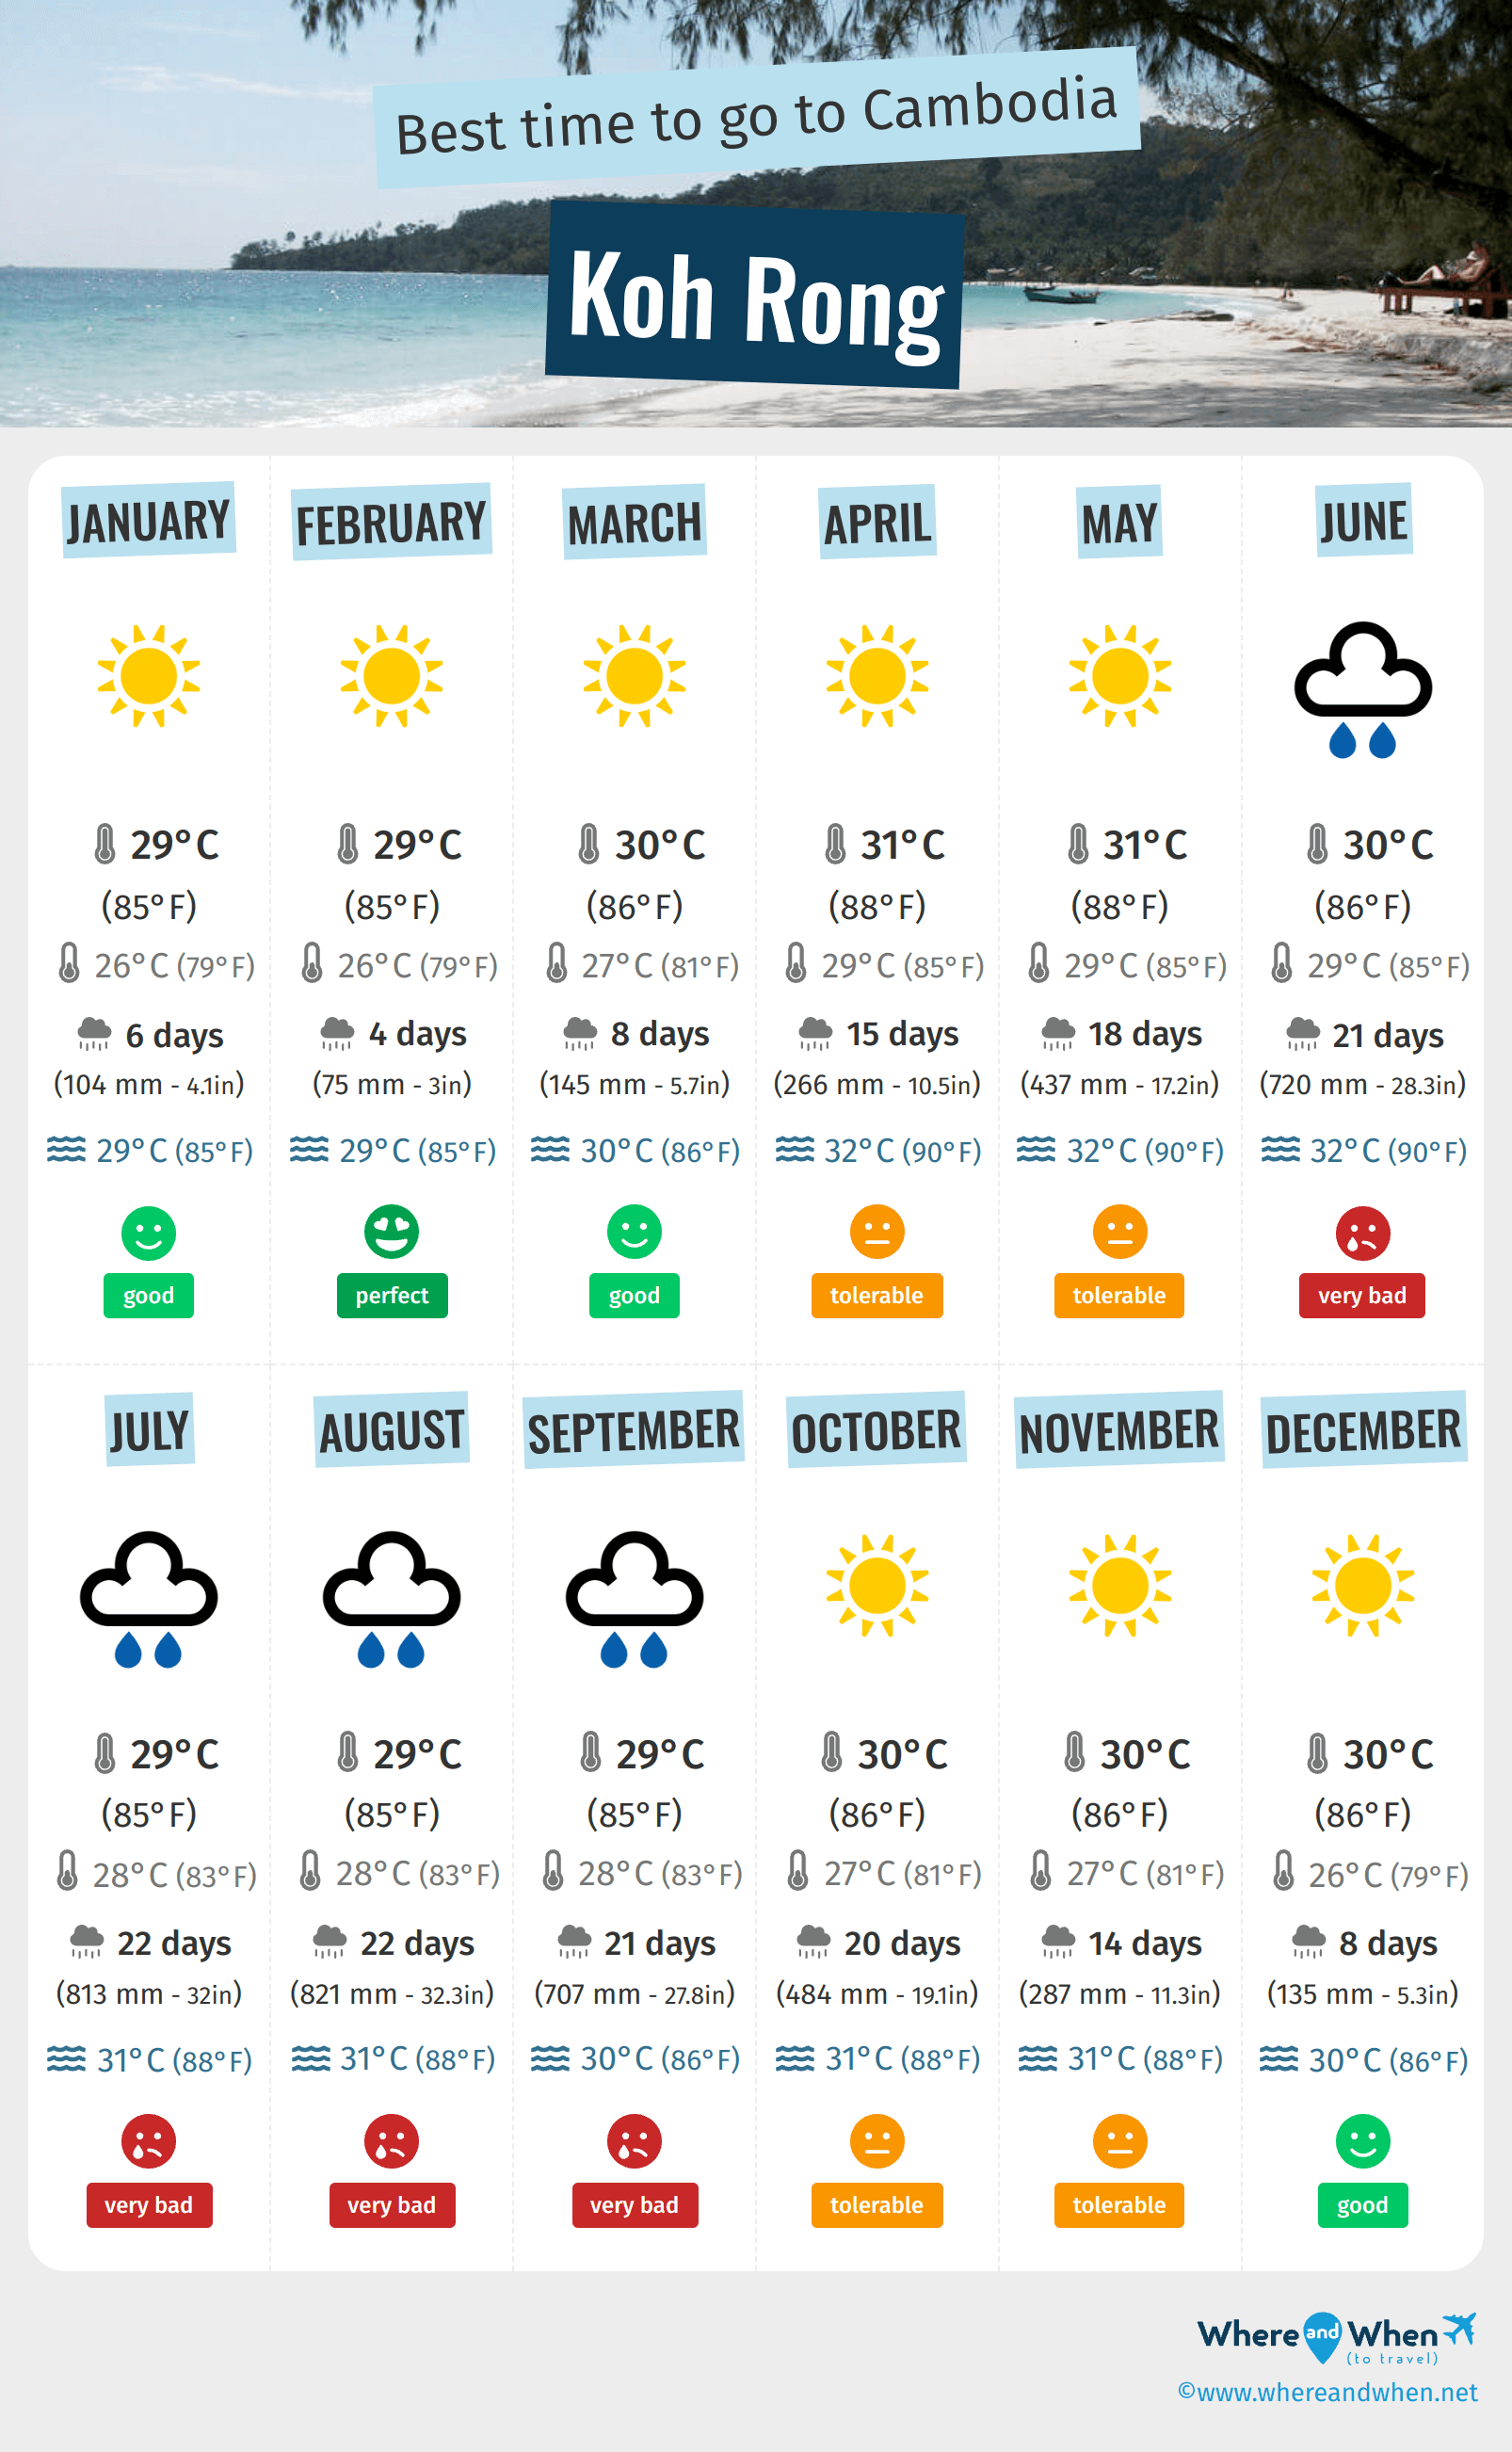
- The best months for good weather in Koh Rong are January, February, March and December
- On average, it is hot all year round
- The rainiest months are June, July, August and September
- The sea temperature is suitable for swimming all year round
Annual weather in Koh Rong
Weather details in Koh Rong month by month
Weather and climate in Koh Rong
Koh Rong enjoys a tropical monsoon climate in accordance with the Köppen-Geiger classification. The yearly average maximum temperature in Koh Rong is 86°F (ranging from 85°F in january to 88°F in may). Annual rainfall is 196.4in, with a minimum of 3in in february and a maximum of 32.3in in august.
- Between the months of january and february the climate is good. At lunchtime, it's 85°F in average and it rains about 13% of the time in february.
- Between the months of march and april the climate is correct. the thermometer goes up to 88°F°C and it rains about 48% of the time in april.
- In may the climate is not good. It is for example 88°F as maximum temperature in may and you can expect to have 17.2in of rainfall/month during this period.
- From june to september the climate is very unfavorable. The record temperature this month is 88°F and, in september, 21 days of rain are expected.
- In the month of october the climate is unfavorable. In average, on the morning it is 81°F.
- Between november and december the climate is passable, but still OK. The record temperature this month is 88°F and you can expect to have 5.3in of rainfall/month during this period.

Charts: temperature and rainfall in Koh Rong
In the charts below, you can see the following seasonal norms for the city of Koh Rong: the minimum and maximum outdoor temperature, the risk and amount of monthly rainfall, daily average sunshine, sea temperature, and relative humidity for each month of the year.
Outside temperature
Precipitation (rainfall)
Daily sunshine hours
Sea temperature
Humidity
Peak visitor numbers and tourist seasons in Koh Rong
Find out when Koh Rong has its high tourist season (the period when the influx of tourists is highest) and off-peak tourist season using our data and figures.
Tourist seasons in Koh Rong
- Very low season in Koh Rong
The months with the lowest number of tourists are: June and September. - Low season in Koh Rong
The months with low numbers of tourists are: April, May, July, August and October. - High season in Koh Rong
The number of visitors to Koh Rong is high in: January, March and November. - Peak season in Koh Rong
The largest number of tourists visiting Koh Rong is during: February and December.
Figure: Visitor index for Koh Rong month by month
Best time for low prices in Koh Rong
Average prices of hotels in Koh Rong month by month
Generally, September is the month with the lowest hotel prices in Koh Rong. So this is a great time to save on your holiday! In contrast, February is statistically the most expensive month of the year for hotels.

Other cities and places near Koh Rong


Chargement en cours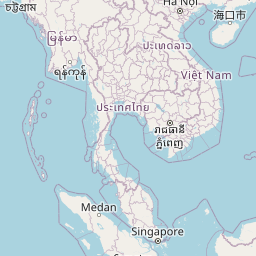
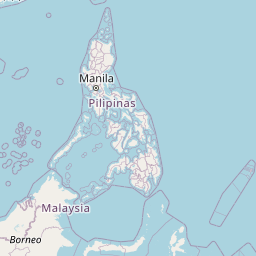


Leaflet | © OpenStreetMap contributors
Legend:
 Koh Rong
 other locations
Koh Rong
other locations