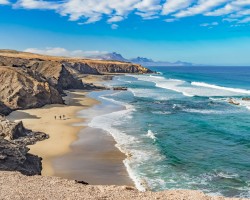
Best time to go to Tuineje Average weather of Tuineje, Fuerteventura
When is the best time to go to Tuineje?
When is the best time to go to Tuineje? Here's some information to help you in your decision:
- The weather is good all year round in Tuineje
- On average, the warmest months are June, July, August, September and October
- Tuineje has dry periods in April, June and July
Annual weather in Tuineje
To get all the information about the climate and weather in Tuineje for a specific month, scroll down below the table and choose a month from the tabs.
| Month | Our opinion | |||
|---|---|---|---|---|
| January | 63°F/68°F | good weather | ||
| February | 63°F/67°F | good weather | ||
| March | 63°F/68°F | good weather | ||
| April | 65°F/70°F | perfect weather | ||
| May | 67°F/72°F | perfect weather | ||
| June | 68°F/74°F | perfect weather | ||
| July | 70°F/77°F | perfect weather | ||
| August | 72°F/77°F | perfect weather | ||
| September | 72°F/77°F | perfect weather | ||
| October | 72°F/77°F | perfect weather | ||
| November | 68°F/72°F | perfect weather | ||
| December | 67°F/70°F | perfect weather |

Weather detail month by month in Tuineje

Weather and climate in Tuineje
Tuineje enjoys a hot desert climate in accordance with the Köppen-Geiger classification. The yearly average maximum temperature in Tuineje is 72°F (ranging from 67°F in february to 77°F in august). Annual rainfall is 7.4in, with a minimum of 0.2in in july and a maximum of 1.1in in october.
- Between the months of january and april the climate is good. It is for example 70°F as maximum temperature in april and it rains about 0.4in each month.
- Between the months of may and november the climate is perfect. By early evening, the temperature averages 72°F and it rains in november about 0.9in.
- In december the climate is beautiful. The temperature rises to 70°F and it rains in december about 0.7in.
Charts: temperature and rainfall in Tuineje
In the charts below, you can see the following seasonal norms for the city of Tuineje: the minimum and maximum outdoor temperature, the risk and amount of monthly rainfall, daily average sunshine, and relative humidity for each month of the year.
Outside temperature
Precipitation (rainfall)
Daily sunshine hours
Humidity
Other cities and places near Tuineje
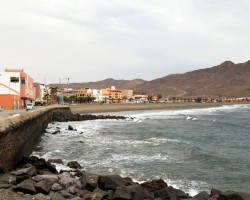
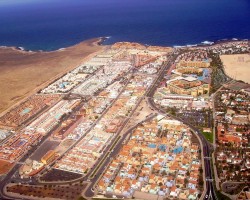


Best time to go to Fuerteventura
Chargement en cours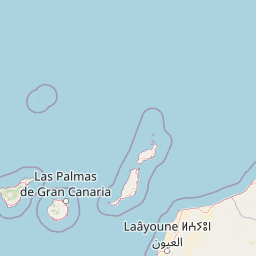


Leaflet | © OpenStreetMap contributors
Legend:
 Tuineje
 other locations
Tuineje
other locations