Panama in november: average Weather, Temperature and Climate, Where to go?
Weather in Panama in november 2025
Here, find the the weather forecast for november for most popular cities in Panama. These predictions are probabilities for november from weather reports for many years. The percentage indicates the probability of having the weather indicated.
Average weather in november in Panama City
bad weather UV index: 7
Weather at 6am
77°F
 Partly Cloudy
36% of time

26%

14%

10%
Weather at 12pm
85°F
 Moderate rain at times
48% of time

36%

14%

3%
Weather at 6pm
79°F
 Heavy rain
57% of time
31%
8%
4%
Weather at 3am
76°F

30%

29%

21%

9%
More information about the weather in Panama City in november
Where to go in Panama in november?
Where to go in Panama in november: destination map
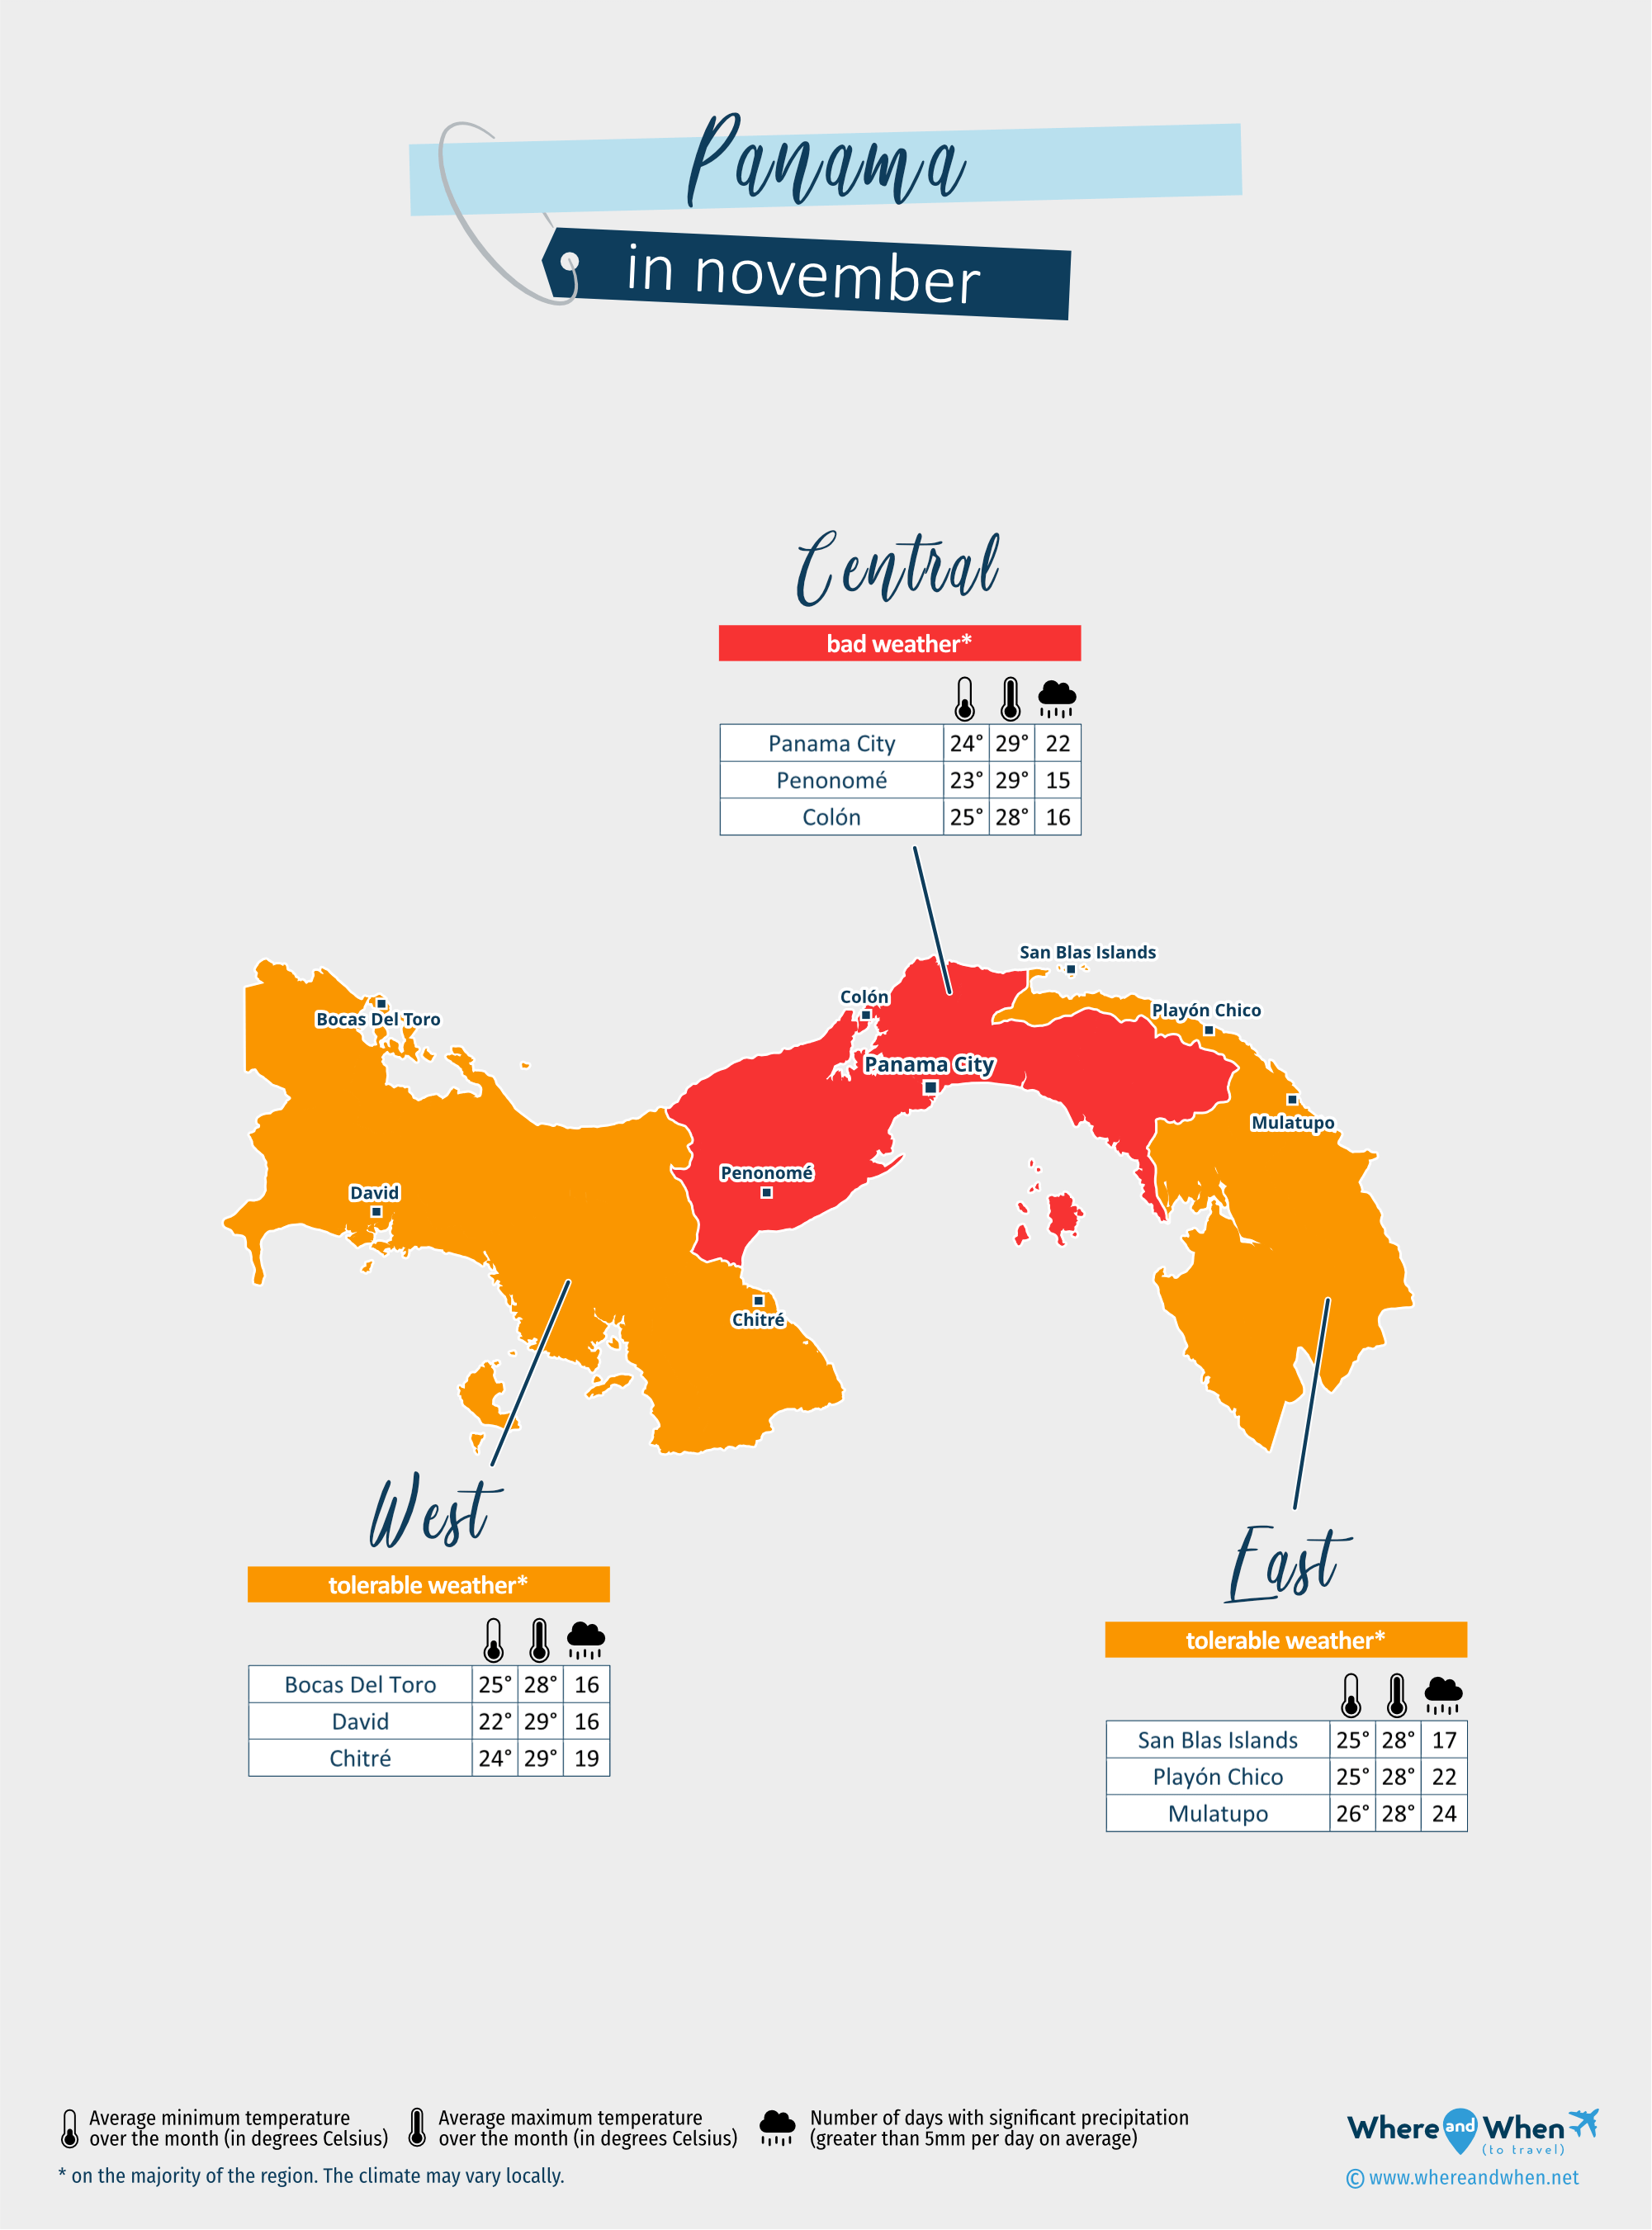
Where to go in each region in november?
| Central of Panama (Panama City, Penonomé, Colón...) | 85°F to 86°F | 15 à 23 days | 83°F to 85°F | bad weather* |
| East of Panama (San Blas Islands, Playón Chico, Mulatupo...) | 83°F to 85°F | 17 à 24 days | 85°F | tolerable weather* |
| West of Panama (Bocas Del Toro, David, Chitré...) | 77°F to 86°F | 13 à 23 days | 83°F to 85°F | tolerable weather* |
Where should you go in Panama in november when it comes to the weather?
Remember:
The climate in Panama in november ranges from tolerable to bad depending on the region and city.
You are lucky: It is not ideal 100%, but the weather in Panama that month should be good in Bocas Del Toro. I allows to appreciate sightseeing in this place. And even why not take a little time to enjoy the hotel pool!
If you do not go lazing in the sun, but, for example to go sightseeing around, the cities of Hicaco Island, El Porvenir, San Blas Islands, Los Santos (Las Tablas), Gamboa, Taboga island, Boquete and Panama City have a ok but correct weather for this kind of activity in november. Finally, avoid going in the cities of Anton and Contadora island in november because the climate is pretty unfavorable.
Climate in Panama in november
Climate in Panama City in november
In november, the mean temperature in Panama City is 81°F (maximum temperature is 85°F and minimum temperature is 77°F). The climate nice around this city in november. With 17.5in over 22 days, the weather is rather to rain for your vacations. Remember to pack rain clothes.
With a correct climate, the month of november is okay (but not good time) for traveling in that area.
| November | |||
| Average temperature | 81°F | ||
| Highest temperature | 85°F | ||
| Lowest temperature | 77°F | ||
| Sea temperature | 83°F | ||
| Rainfall | 17.5in | ||
| Number of days with rainfall | 22 day(s) (74%) | ||
| Humidity | 92% | ||
| Daily sunshine hours | 8 | ||
| Cloud cover | 50% | ||
| Length of day | 11:43 | ||
| Our opinion at whereandwhen.net | bad |
Climate in Bocas Del Toro in november
In the month of november, maximum temperature is 85°F and minimum temperature is 79°F (for an average temperature of 81°F). The climate is very hot in that area in november. With 12in over 16 days, you will experience some showers during your trip. But this is pretty moderate and you will not be too bothered by it.
With a good climate, the month of november is a good time to go in this locality.
| November | |||
| Average temperature | 81°F | ||
| Highest temperature | 85°F | ||
| Lowest temperature | 79°F | ||
| Sea temperature | 83°F | ||
| Rainfall | 12in | ||
| Number of days with rainfall | 16 day(s) (54%) | ||
| Humidity | 77% | ||
| Daily sunshine hours | 11 | ||
| Cloud cover | 42% | ||
| Length of day | 11:41 | ||
| Our opinion at whereandwhen.net | tolerable |
Climate in Chitré in november
In the month of november, the mean temperature in Chitré is 81°F (maximum temperature is 85°F and minimum temperature is 76°F). The climate is burning around this city in this month. With 12.2in over 19 days, you may find yourself often in the rain throughout your stay. Remember to bring Rain coats.
| November | |||
| Average temperature | 81°F | ||
| Highest temperature | 85°F | ||
| Lowest temperature | 76°F | ||
| Sea temperature | 83°F | ||
| Rainfall | 12.2in | ||
| Number of days with rainfall | 19 day(s) (63%) | ||
| Humidity | 91% | ||
| Daily sunshine hours | 10 | ||
| Cloud cover | 44% | ||
| Length of day | 11:46 | ||
| Our opinion at whereandwhen.net | tolerable |
Climate in Colón in november
In the month of november, maximum temperature is 85°F and minimum temperature is 79°F (for an average temperature of 81°F). The climate is very hot here in this month. With 11.1in over 16 days, you will suffer the rain throughout your vacations. Remember to pack rain clothes.
| November | |||
| Average temperature | 81°F | ||
| Highest temperature | 85°F | ||
| Lowest temperature | 79°F | ||
| Sea temperature | 83°F | ||
| Rainfall | 11.1in | ||
| Number of days with rainfall | 16 day(s) (53%) | ||
| Humidity | 87% | ||
| Daily sunshine hours | 8 | ||
| Cloud cover | 50% | ||
| Length of day | 11:42 | ||
| Our opinion at whereandwhen.net | tolerable |
Climate in David in november
In the month of november, the mean temperature in David is 79°F (maximum temperature is 86°F and minimum temperature is 74°F). The climate is very warm here in this month. With 14.2in over 16 days, rain is to be feared for your stay. Consider to bring clothes for rain.
With a correct weather, the month of november is okay (but not good month) for traveling in that area in Panama.
| November | |||
| Average temperature | 79°F | ||
| Highest temperature | 86°F | ||
| Lowest temperature | 74°F | ||
| Sea temperature | 83°F | ||
| Rainfall | 14.2in | ||
| Number of days with rainfall | 16 day(s) (54%) | ||
| Humidity | 85% | ||
| Daily sunshine hours | 11 | ||
| Cloud cover | 40% | ||
| Length of day | 11:44 | ||
| Our opinion at whereandwhen.net | tolerable |
All cities in Panama in november
| Panama City in november | bad weather |
| Bocas Del Toro in november | tolerable weather |
| Chitré in november | tolerable weather |
| Colón in november | tolerable weather |
| David in november | tolerable weather |
| San Blas Islands in november | tolerable weather |
| Mulatupo in november | bad weather |
| Penonomé in november | tolerable weather |
| Playón Chico in november | bad weather |
| Anton in november | tolerable weather |
| Boquete in november | tolerable weather |
| El Porvenir in november | tolerable weather |
| Gamboa in november | bad weather |
| Contadora island in november | bad weather |
| Taboga island in november | bad weather |
| Los Santos (Las Tablas) in november | tolerable weather |
| Hicacos Peninsula in november | bad weather |
| Aguadulce in november | tolerable weather |
| Arraijan in november | bad weather |
| Buabidi in november | tolerable weather |
| Chame in november | bad weather |
| Chiriqui in november | tolerable weather |
| Cocle in november | tolerable weather |
| Dolega District in november | tolerable weather |
| La Chorrera in november | bad weather |
| San Miguelito in november | bad weather |
| Soná in november | bad weather |
Weather data for Panama in november:
Weather data for Panama in november is derived from an average of the weather forecast since 2009 in Panama. There is a margin of error and these forecasts are to be considered as general information only. The weather in Panama can vary slightly from year to year, but these predictions should limit surprises. So you can pack your bags and check when is the best time to go to Panama.