Best time to go to Chabla Average weather of Chabla, Bulgaria
When is the best time to go to Chabla?
When is the best time to go to Chabla? Here's some information to help you in your decision:
- The best months for good weather in Chabla are May, June, July, August, September and October
- On average, the warmest months are July and August
- January is the coldest month of the year
- The rainiest months are January and October
- The best months for swimming are June, July, August and September
Annual weather in Chabla
To get all the information about the climate and weather in Chabla for a specific month, scroll down below the table and choose a month from the tabs.
| Month | Our opinion | |||
|---|---|---|---|---|
| January | 38°F/43°F | very bad weather | ||
| February | 40°F/45°F | very bad weather | ||
| March | 45°F/50°F | bad weather | ||
| April | 52°F/58°F | tolerable weather | ||
| May | 61°F/67°F | good weather | ||
| June | 70°F/76°F | perfect weather | ||
| July | 76°F/81°F | perfect weather | ||
| August | 77°F/83°F | perfect weather | ||
| September | 68°F/76°F | perfect weather | ||
| October | 59°F/65°F | good weather | ||
| November | 52°F/56°F | tolerable weather | ||
| December | 41°F/49°F | very bad weather |


Weather detail month by month in Chabla
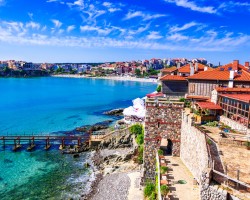
Weather and climate in Chabla
Chabla enjoys a humid subtropical climate (without dry season and with hot summer) in accordance with the Köppen-Geiger classification. The yearly average maximum temperature in Chabla is 63°F (ranging from 43°F in january to 83°F in august). Annual rainfall is 24.5in, with a minimum of 0.9in in august and a maximum of 3.4in in october.
- Between january and february the climate is the worst possible. the thermometer goes up to 45°F°C and you can expect to have 2.2in of rainfall/month during this period.
- In march the climate is not good. At lunchtime, it's 50°F in average and it rains about 1.7in each month.
- In april the climate is okay. The temperature rises to 58°F.
- Between may and june the climate is good. At lunchtime, it's 76°F in average and it rains about 12% of the time in june.
- Between july and september the climate is perfect. By early evening, the temperature averages 70°F and it rains about 9% of the time in september.
- In october the climate is beautiful. By early evening, the temperature averages 61°F and you can expect to have 3.4in of rainfall/month during this period.
- In november the climate is passable, but still OK. At lunchtime, it's 56°F in average.
- In december the climate is the worst possible. The record temperature this month is 63°F and you can expect to have 2.5in of rainfall/month during this period.
Charts: temperature and rainfall in Chabla
In the charts below, you can see the following seasonal norms for the city of Chabla: the minimum and maximum outdoor temperature, the risk and amount of monthly rainfall, daily average sunshine, sea temperature, and relative humidity for each month of the year.
Outside temperature
Precipitation (rainfall)
Daily sunshine hours
Sea temperature
Humidity
Other cities and places near Chabla


Chargement en cours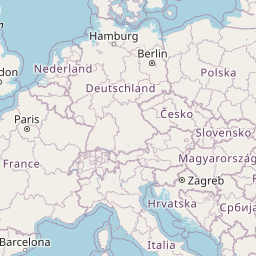
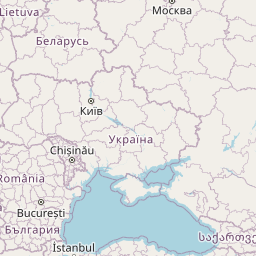
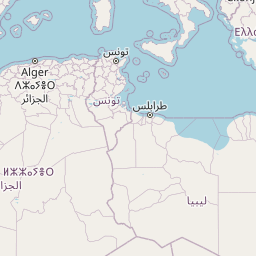


Leaflet | © OpenStreetMap contributors
Legend:
 Chabla
 other locations
Chabla
other locations