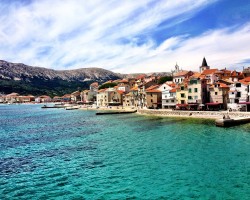
Best time to go to Ilovik island Average weather of Ilovik island, Croatian islands
When is the best time to go to Ilovik island?
When is the best time to go to Ilovik island? Here's some information to help you in your decision:
- The best months for good weather in Ilovik island are April, May, June, July, August, September and October
- On average, the warmest months are July and August
- The coldest months are January and February
- November is the rainiest month
- The best months for swimming are June, July, August and September
Annual weather in Ilovik island
For full information about the climate and weather in Ilovik island a specific month, click on the corresponding line below:
| Month | Our opinion | ||||
|---|---|---|---|---|---|
| January | 49°F/52°F | bad weather | Ilovik island in january | ||
| February | 49°F/52°F | bad weather | Ilovik island in february | ||
| March | 52°F/56°F | tolerable weather | Ilovik island in march | ||
| April | 58°F/61°F | good weather | Ilovik island in april | ||
| May | 63°F/67°F | good weather | Ilovik island in may | ||
| June | 72°F/76°F | perfect weather | Ilovik island in june | ||
| July | 77°F/81°F | good weather | Ilovik island in july | ||
| August | 77°F/81°F | perfect weather | Ilovik island in august | ||
| September | 72°F/76°F | good weather | Ilovik island in september | ||
| October | 65°F/68°F | good weather | Ilovik island in october | ||
| November | 58°F/61°F | tolerable weather | Ilovik island in november | ||
| December | 52°F/56°F | tolerable weather | Ilovik island in december |

Weather and climate in Ilovik island
Ilovik island enjoys a humid subtropical climate (without dry season and with hot summer) in accordance with the Köppen-Geiger classification. The yearly average maximum temperature in Ilovik island is 67°F (ranging from 52°F in january to 81°F in august). Annual rainfall is 65.7in, with a minimum of 2.4in in august and a maximum of 10.4in in november.
- Between the months of january and march the climate is bad. It is for example 56°F as maximum temperature in march.
- In the month of april the climate is okay. The record temperature this month is 72°F and it rains in april about 3.7in.
- Between may and june the climate is good. At lunchtime, it's 76°F in average and it rains about 2.8in each month.
- Between the months of july and august the climate is very good. It is for example 81°F as maximum temperature in august and it rains in august about 2.4in.
- Between september and october the climate is good. The record temperature this month is 79°F and it rains about 22% of the time in october.
- In november the climate is not good, but still OK. By early evening, the temperature averages 59°F.
- In the month of december the climate is not good. The record temperature this month is 65°F.

Charts: temperature and rainfall in Ilovik island
In the charts below, you can see the following seasonal norms for the city of Ilovik island: the minimum and maximum outdoor temperature, the risk and amount of monthly rainfall, daily average sunshine, sea temperature, and relative humidity for each month of the year.
Outside temperature
Precipitation (rainfall)
Daily sunshine hours
Sea temperature
Humidity
Other cities and places near Ilovik island


Best time to go to the Croatian Islands
Chargement en cours
Legend:
 Ilovik island
 other locations
Ilovik island
other locations