Mai Khao Beach in october: average Weather, Temperature and Climate
Weather in Mai Khao Beach in october 2025
The weather in Mai Khao Beach in the month of october comes from statistical datas on the past years. You can view the weather statistics the entire month, but also by clicking on the tabs for the beginning, the middle and the end of the month.
Average weather throughout october
tolerable weather UV index: 7
Weather at 6am
81°F
 Partly Cloudy
32% of time

24%

21%

19%
Weather at 12pm
85°F
 Clear/Sunny
34% of time

24%
22%
18%
Weather at 6pm
83°F
 Moderate rain at times
34% of time
30%
22%
13%
Weather at 3am
83°F

38%

25%

20%

15%
Evolution of daily average temperature and precipitation in Mai Khao Beach in october
These charts show the evolution of average minimum/maximum temperatures as well as average daily precipitation volume in Mai Khao Beach in october.
The climate of Mai Khao Beach in october is tolerable
The climate in october in Mai Khao Beach is wet (with 15.1in of rainfall over 19 days). It should be noted an improvement from the previous month since in september it receives an average of 15.7in of rainfall over 17 days.
The climate quite enjoyable here the month of october. Temperatures are up to 85°F. On average, the recorded minimum temperature is 81°F. Thus, the mean temperature average on this month of october in Mai Khao Beach is 83°F. These temperatures are far removed from those records observed in Mai Khao Beach in october with a maximum record of 90°F in 2021 and a minimum record of 74°F in 2020. You can expect to have about 7 days with temperatures above 86°F, or 23 of time.
In october in Mai Khao Beach, the days on average last 11:57. The sun rises at 06:14 and sets at 18:11.
With proper weather, october is okay (but not good) to go in Mai Khao Beach in Phuket.
Seasonal average climate and temperature of Mai Khao Beach in october
Check below seasonal norms These datas are compiled from the weather statements of the past years of the month of october.
| October | |||||
| Outside temperature | |||||
| Average temperature | 83°F | ||||
| Highest temperature | 85°F | ||||
| Lowest temperature | 81°F | ||||
| Highest record temperature | 90°F (2021) | ||||
| Lowest record temperature | 74°F (2020) | ||||
| Number of days at +86°F | 7 day(s) (23%) | ||||
| Number of days at +65°F | 31 day(s) (100%) | ||||
| Sea temperature | |||||
| Average sea temperature | 85°F | ||||
| Lowest sea temperature | 83°F | ||||
| Highest sea temperature | 87°F | ||||
| Wind | |||||
| Wind speed | 18km/h | ||||
| Wind temperature | 81°F | ||||
| Precipitation (rainfall) | |||||
| Rainfall | 15.1in | ||||
| Number of days with rainfall | 19 day(s) (60%) | ||||
| Record daily rainfall | 3.2in (2014) | ||||
| Other climate data | |||||
| Humidity | 80% | ||||
| Visibility | 8.98km | ||||
| Cloud cover | 42% | ||||
| UV index | 7 | ||||
| Daily sunshine hours | 11 | ||||
| Sunrise and sunset | |||||
| Time of sunrise | 06:14 | ||||
| Time of sunset | 18:11 | ||||
| Length of day | 11:57 | ||||
| Our opinion about the weather in october | |||||
| Our opinion at whereandwhen.net | tolerable | ||||
How was the weather last october?
Here is the day by day recorded weather in Mai Khao Beach in october 2024:

81°F to 85°F
81°F to 85°F
81°F to 85°F
79°F to 83°F
79°F to 83°F
79°F to 83°F

77°F to 81°F
77°F to 85°F
79°F to 85°F
79°F to 85°F
79°F to 83°F
79°F to 83°F
79°F to 85°F

79°F to 85°F

81°F to 83°F
81°F to 85°F

81°F to 85°F
81°F to 85°F

77°F to 79°F
81°F to 83°F
81°F to 85°F
81°F to 85°F
81°F to 85°F
81°F to 83°F
79°F to 83°F
79°F to 83°F
81°F to 85°F
81°F to 83°F
81°F to 85°F
81°F to 85°F
81°F to 85°F
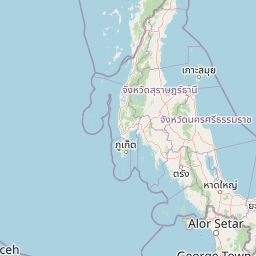
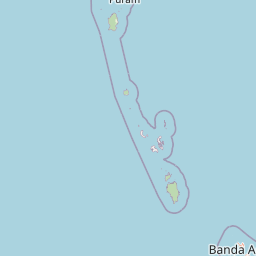
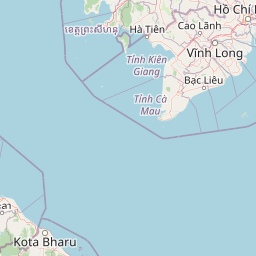
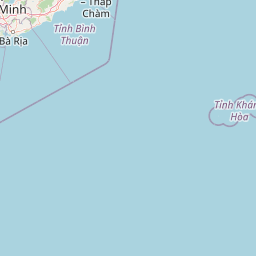
Map: other cities in Phuket in october
Cities near Mai Khao Beach:
| Nai Yang Beach in october | tolerable weather |
| Sirinat National Park in october | tolerable weather |
| Sai Kaew Beach in october | tolerable weather |
| Pa Klok in october | tolerable weather |
| Bang Tao Beach in october | tolerable weather |
| Bang Rong in october | tolerable weather |
| Kamala Beach in october | tolerable weather |
| Kathu in october | tolerable weather |
| Patong in october | tolerable weather |
| Bang Wad in october | tolerable weather |
| Phuket town in october | tolerable weather |
| Koh Siray in october | tolerable weather |
Click over cities on the map for information about the weather in october.


 Mai Khao Beach
 perfect weather
 good
good
 tolerable
 bad
bad
 very bad
Weather data for Mai Khao Beach in october:
Weather data for Mai Khao Beach for october are derived from an average of the weather forecast since 2009 in Mai Khao Beach. There is a margin of error and these forecasts are to be considered as general information only. The weather in Mai Khao Beach can vary slightly from year to year, but this data should limit surprises. So you can pack your bags or check for the best time in year to go to Mai Khao Beach.