Masca in august: average Weather, Temperature and Climate
Weather in Masca in august 2025
The weather in Masca in the month of august comes from statistical datas on the past years. You can view the weather statistics the entire month, but also navigating through the tabs for the beginning, the middle and the end of the month.
Average weather throughout august
perfect weather UV index: 7
Weather at 6am
74°F
 Clear/Sunny
88% of time


12%

1%

1%
Weather at 12pm
77°F
Clear/Sunny
89% of time
11%
1%
1%
Weather at 6pm
77°F
Clear/Sunny
91% of time
10%
1%

1%
Weather at 3am
74°F

90%

9%

2%

1%
Evolution of daily average temperature and precipitation in Masca in august
These charts show the evolution of average minimum/maximum temperatures as well as average daily precipitation volume in Masca in august.
The climate of Masca in august is perfect
The climate in august in Masca is dry ; it hardly ever rains (0.2in of precipitation over 0 days).
The climate pleasant in that area the month of august. The thermometer averaged maximum of 77°F. The minimum is 74°F. Thus, the mean temperature average on this month of august in Masca is 76°F. Note that these seasonal averages are in contrast with those observed in Masca in the month of august with a maximum record of 92°F in 2020 and a minimum record of 58°F in 2020. You You can hope to have about 0 days with temperatures over 86°F, or 0 of time.
Day length in Masca in august is 13:09. The sun rises at 06:37 and sunset is at 19:46.
With a perfect weather, the month of august is advisable to go in Masca.
Seasonal average climate and temperature of Masca in august
Check below seasonal norms These datas are compiled from the weather statements of the last years of august.
| August | |||||
| Outside temperature | |||||
| Average temperature | 76°F | ||||
| Highest temperature | 77°F | ||||
| Lowest temperature | 74°F | ||||
| Highest record temperature | 92°F (2020) | ||||
| Lowest record temperature | 58°F (2020) | ||||
| Number of days at +86°F | 0 day(s) (0%) | ||||
| Number of days at +65°F | 31 day(s) (100%) | ||||
| Sea temperature | |||||
| Average sea temperature | 74°F | ||||
| Lowest sea temperature | 72°F | ||||
| Highest sea temperature | 76°F | ||||
| Wind | |||||
| Wind speed | 22km/h | ||||
| Wind temperature | 74°F | ||||
| Precipitation (rainfall) | |||||
| Rainfall | 0.2in | ||||
| Record daily rainfall | 0.3in (2010) | ||||
| Other climate data | |||||
| Humidity | 78% | ||||
| Visibility | 9.98km | ||||
| Cloud cover | 6% | ||||
| UV index | 7 | ||||
| Daily sunshine hours | 12 | ||||
| Sunrise and sunset | |||||
| Time of sunrise | 06:37 | ||||
| Time of sunset | 19:46 | ||||
| Length of day | 13:09 | ||||
| Our opinion about the weather in august | |||||
| Our opinion at whereandwhen.net | perfect | ||||
How was the weather last august?
Here is the day by day recorded weather in Masca in august 2024:

74°F to 81°F
76°F to 83°F
77°F to 85°F
76°F to 83°F
74°F to 79°F
72°F to 79°F
72°F to 77°F
74°F to 77°F
74°F to 81°F
76°F to 81°F
74°F to 79°F
76°F to 81°F
77°F to 83°F
77°F to 83°F
74°F to 79°F
72°F to 79°F
74°F to 81°F
76°F to 85°F
79°F to 85°F
79°F to 81°F
77°F to 83°F
77°F to 81°F
74°F to 79°F
70°F to 77°F
72°F to 79°F
74°F to 81°F

76°F to 79°F
74°F to 77°F
70°F to 77°F

70°F to 76°F
70°F to 76°F
Map: other cities on the island of Tenerife in august
Cities near Masca:
| Parque de Teno in august | perfect weather |
| Santiago del Teide in august | perfect weather |
| Los Gigantes in august | perfect weather |
| Buenavista del Norte in august | perfect weather |
| Garachico in august | perfect weather |
| Playa San Juan in august | perfect weather |
| Icod de los Vinos in august | perfect weather |
| La Guancha in august | perfect weather |
| Callao Salvaje in august | perfect weather |
| San Juan de la Rambla in august | perfect weather |
| Teide National Park in august | perfect weather |
| Barranco del Infierno in august | perfect weather |
Click over cities on the map for information about the weather in august.
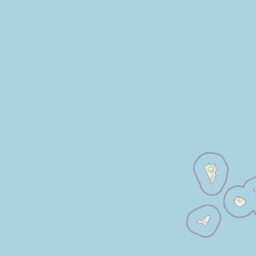


 Masca
Masca
 perfect weather
 good
good
 tolerable
 bad
bad
 very bad
Weather data for Masca in august:
Weather data for Masca for august are derived from an average of the weather forecast since 2009 in Masca. There is a margin of error and these forecasts are to be considered as general information only. The weather in Masca can vary slightly from year to year, but this data should limit surprises. So you can pack your bags or check for the best time in year to go to Masca.