Best time to go to La Roche-sur-Yon Average weather of La Roche-sur-Yon, Vendée
When is the best time to go to La Roche-sur-Yon?
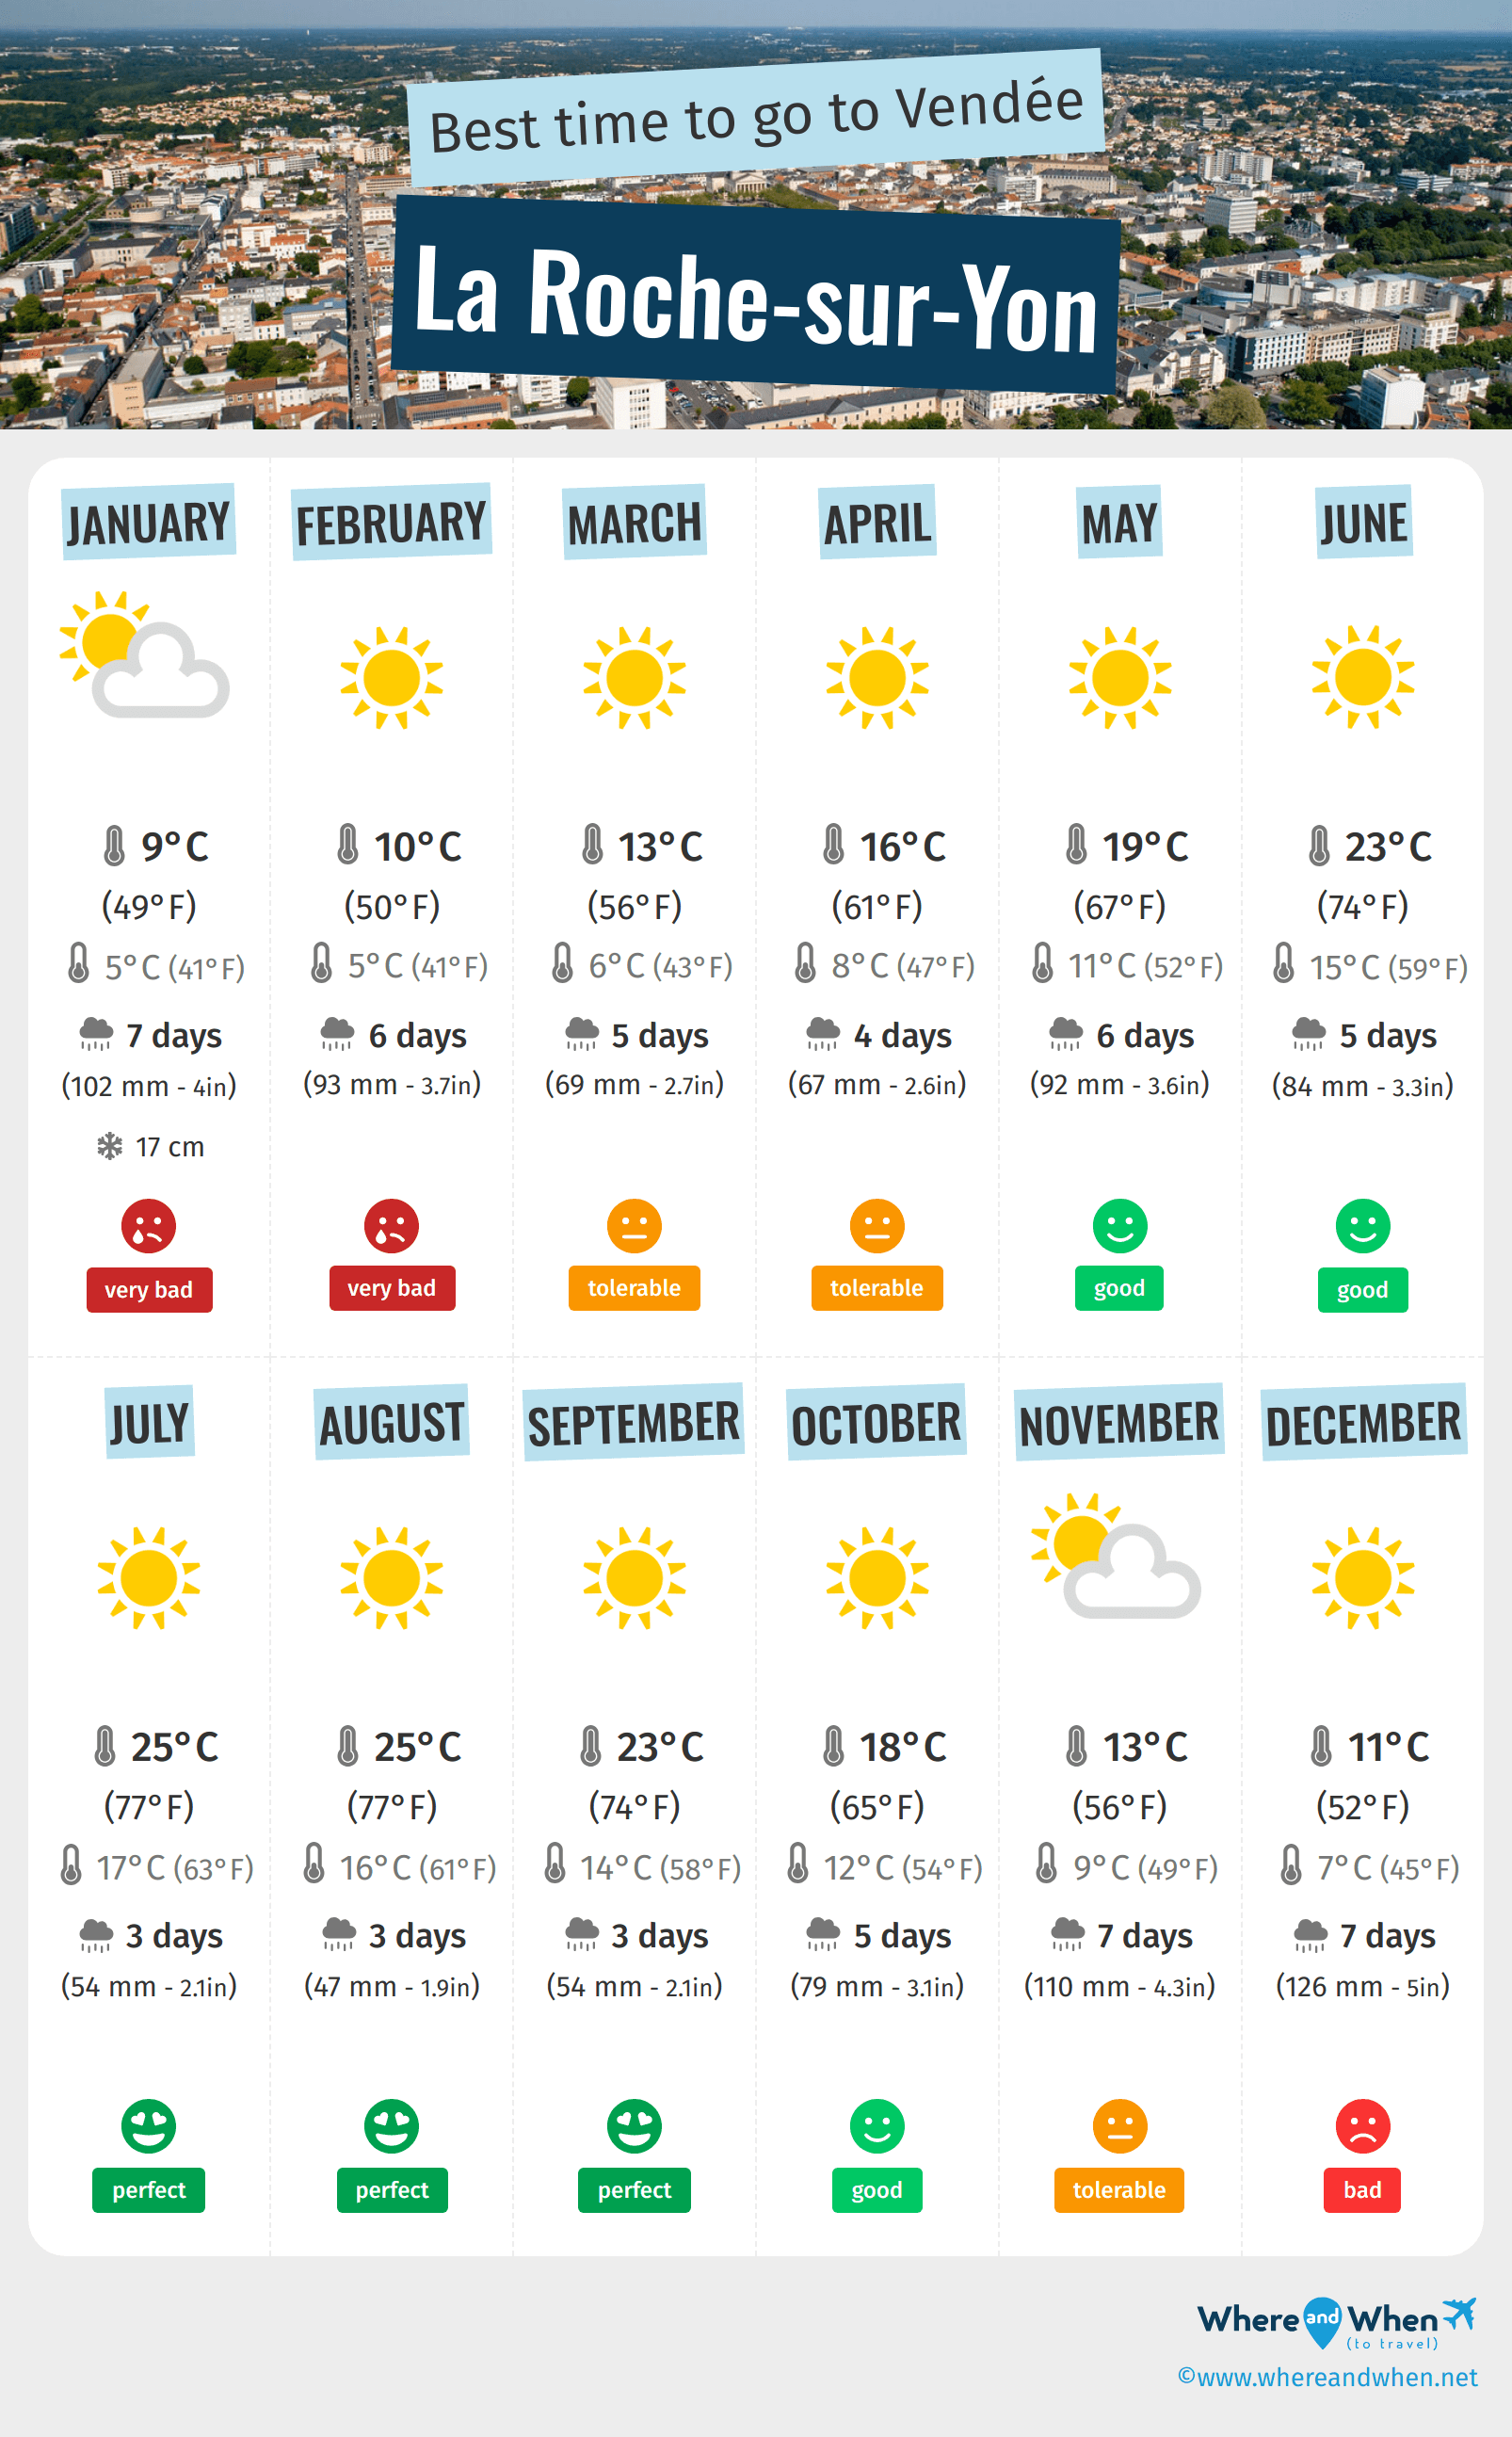
When is the best time to go to La Roche-sur-Yon? Here's some information to help you in your decision:
- The best months for good weather in La Roche-sur-Yon are May, June, July, August, September and October
- On average, the warmest months are July, August and September
- The coldest months are January and February
- The rainiest months are January, November and December
Annual weather in La Roche-sur-Yon
Weather details in La Roche-sur-Yon month by month
Weather and climate in La Roche-sur-Yon
La Roche-sur-Yon enjoys a temperate oceanic climate (with warm summer) in accordance with the Köppen-Geiger classification. The yearly average maximum temperature in La Roche-sur-Yon is 63°F (ranging from 49°F in january to 77°F in august). Annual rainfall is 38.2in, with a minimum of 1.9in in august and a maximum of 5in in december.
- Between the months of january and february the climate is very bad. At lunchtime, it's 49°F in average and, in february, 6 days of rain are expected.
- From march to april the climate is correct. At lunchtime, it's 59°F in average and it rains about 13% of the time in april.
- Between may and august the climate is beautiful. The record temperature this month is 101°F.
- In september the climate is perfect. At lunchtime, it's 74°F in average.
- In the month of october the climate is beautiful. It is for example 65°F as maximum temperature in october and it rains about 15% of the time in october.
- In november the climate is correct. In average, on the morning it is 49°F and it rains in november about 4.3in.
- In the month of december the climate is unfavorable. At lunchtime, it's 50°F in average and it rains about 5in each month.

Charts: temperature and rainfall in La Roche-sur-Yon
In the charts below, you can see the following seasonal norms for the city of La Roche-sur-Yon: the minimum and maximum outdoor temperature, the risk and amount of monthly rainfall, daily average sunshine, and relative humidity for each month of the year.
Outside temperature
Precipitation (rainfall)
Daily sunshine hours
Humidity
Best time for low prices in La Roche-sur-Yon
Average price of hiring a car in La Roche-sur-Yon
On average, it costs $ 49 per day to hire a car in La Roche-sur-Yon. This price varies by $ 18 depending on the month. In september, hiring a car costs an average of $ 42 per 24 hours, so this is the best time to save money! In contrast, the average price in july is $ 59.
Other cities and places near La Roche-sur-Yon


Chargement en cours
Legend:
 La Roche-sur-Yon
 other locations
La Roche-sur-Yon
other locations