Best time to go to Les Sables-d'Olonne Average weather of Les Sables-d'Olonne, Vendée
When is the best time to go to Les Sables-d'Olonne?
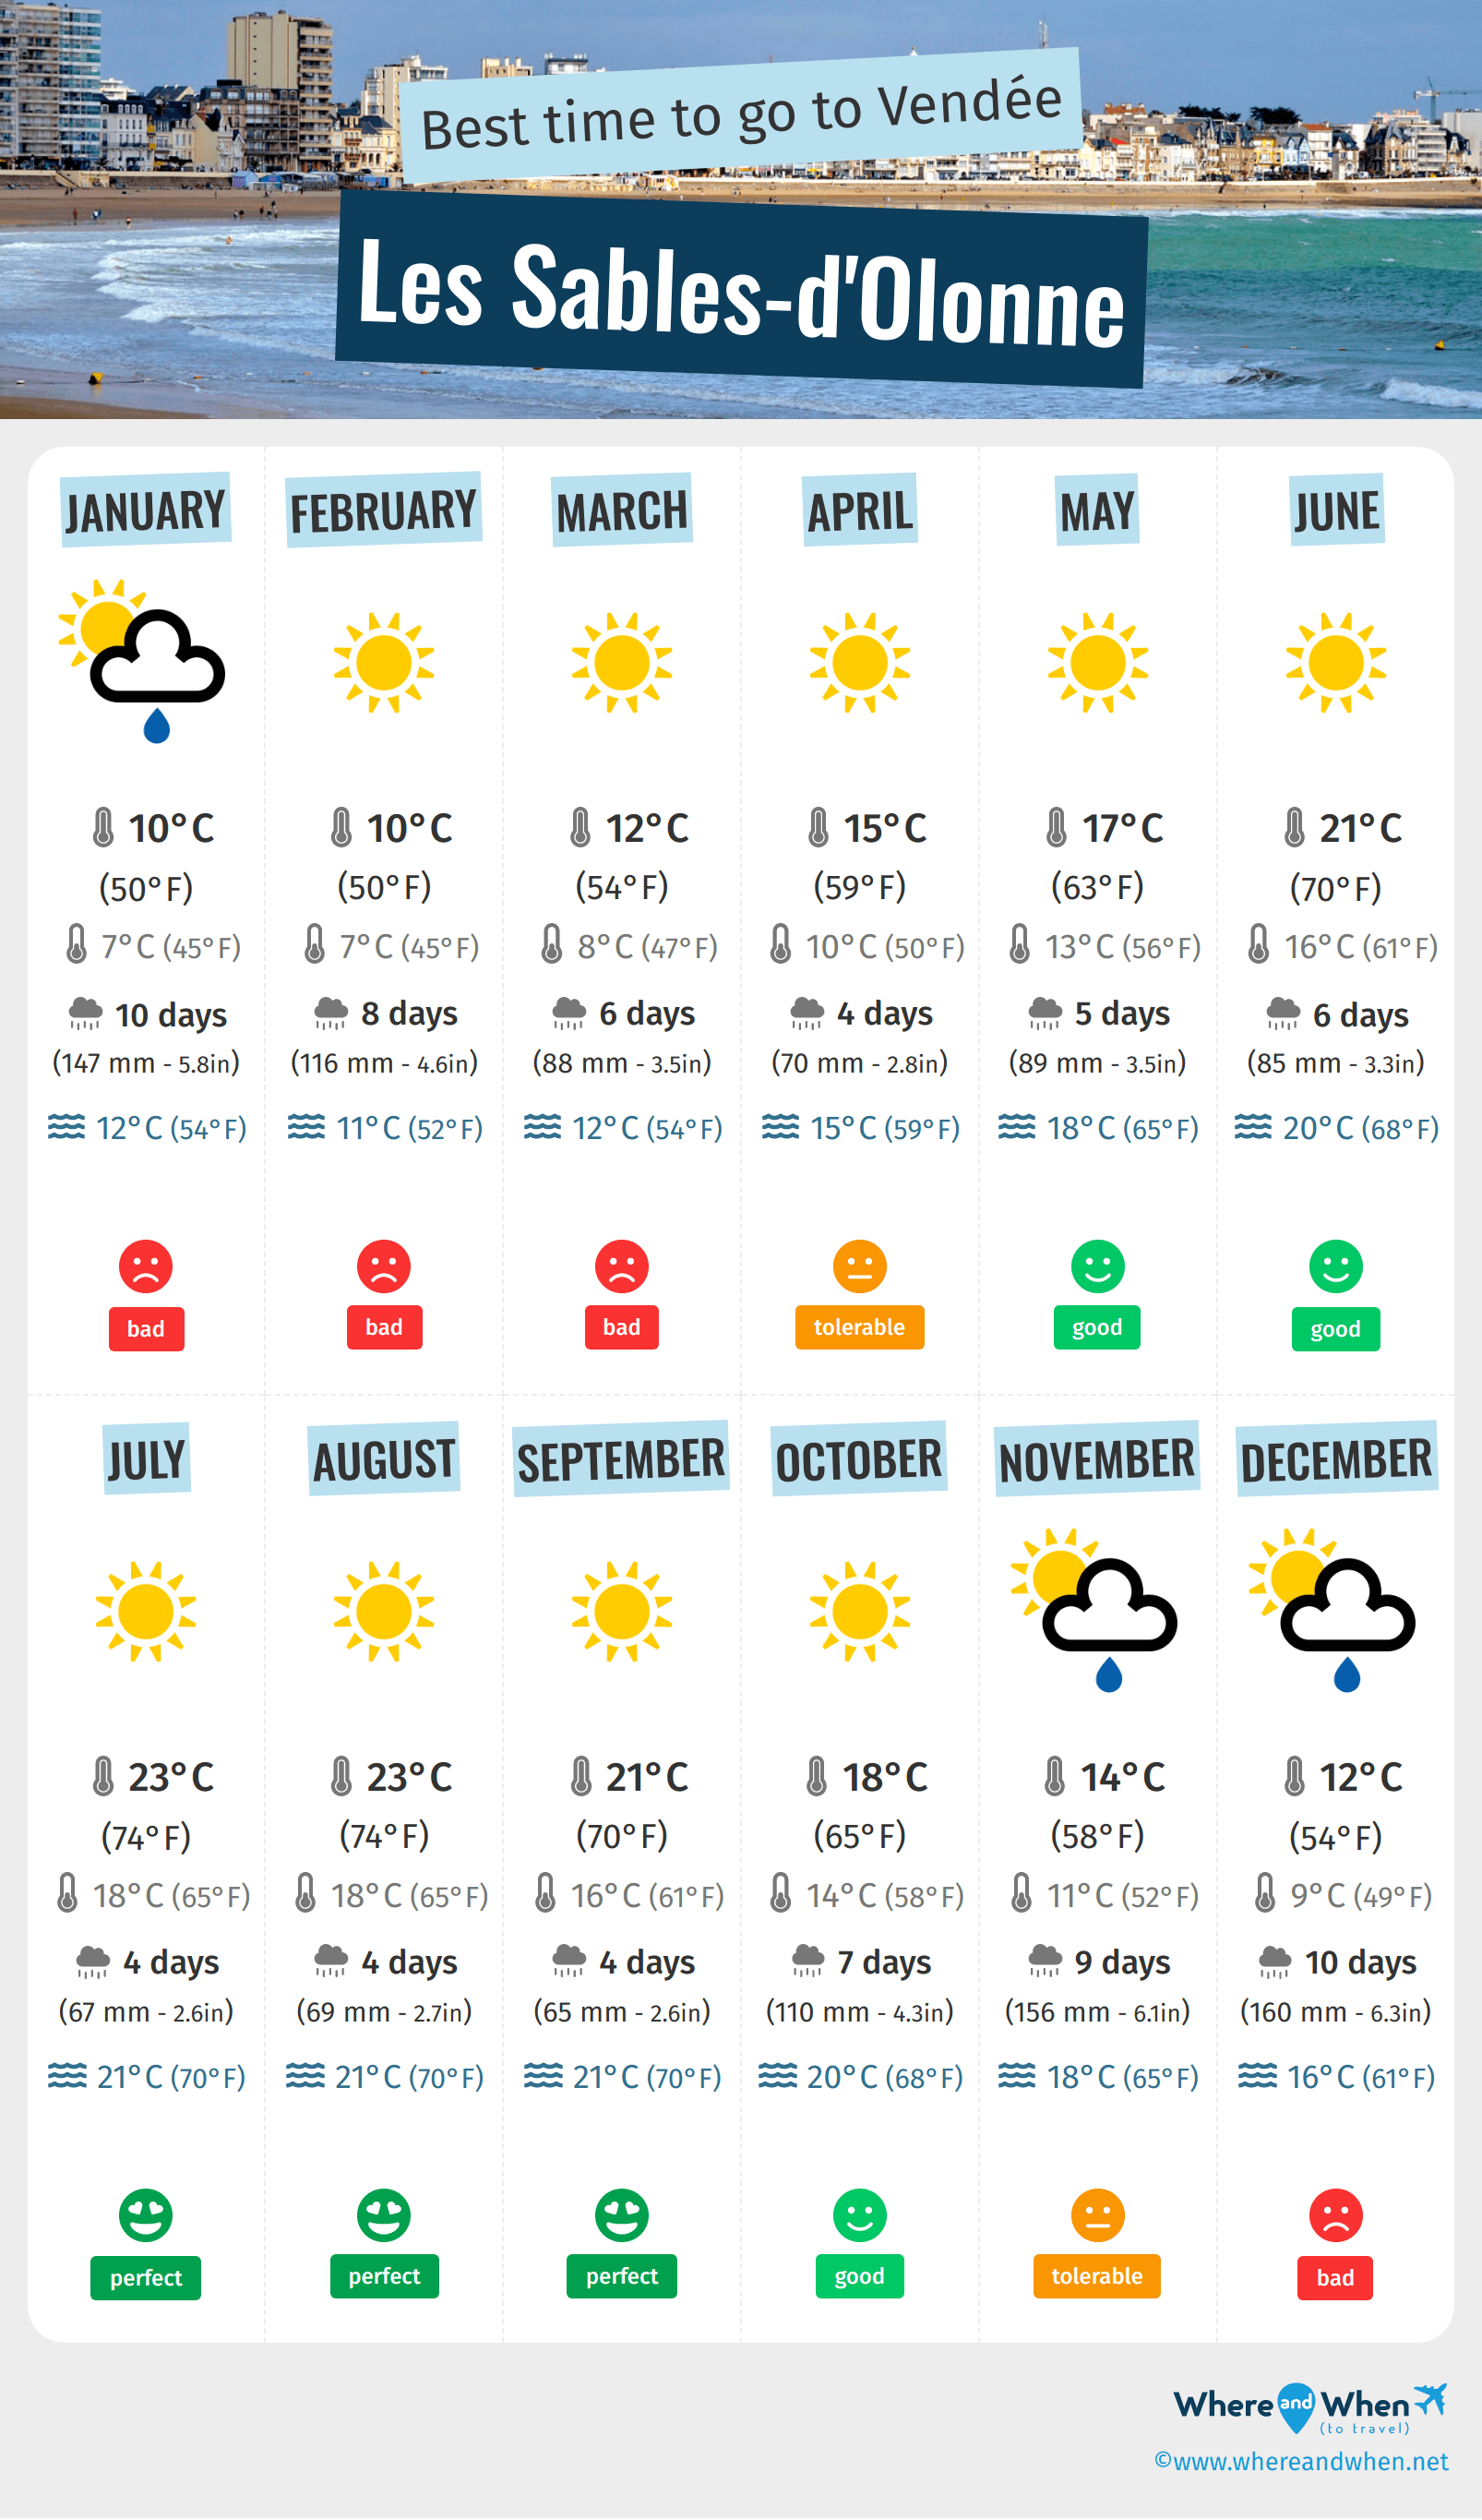
When is the best time to go to Les Sables-d'Olonne? Here's some information to help you in your decision:
- The best months for good weather in Les Sables-d'Olonne are May, June, July, August, September and October
- On average, the warmest months are June, July, August and September
- The coldest months are January and February
- The rainiest months are January, November and December
- The best months for swimming are June, July, August, September and October
Annual weather in Les Sables-d'Olonne
Weather details in Les Sables-d'Olonne month by month
Weather and climate in Les Sables-d'Olonne
Les Sables-d'Olonne enjoys a temperate oceanic climate (with warm summer) in accordance with the Köppen-Geiger classification. The yearly average maximum temperature in Les Sables-d'Olonne is 61°F (ranging from 50°F in january to 74°F in august). Annual rainfall is 47.9in, with a minimum of 2.6in in september and a maximum of 6.3in in december.
- Between the months of january and march the climate is bad. By early evening, the temperature averages 52°F and, in march, 6 days of rain are expected.
- In april the climate is passable, but still OK. the thermometer goes up to 59°F°C and, in april, 4 days of rain are expected.
- Between the months of may and october the climate is beautiful. By early evening, the temperature averages 61°F and you can expect to have 4.3in of rainfall/month during this period.
- In november the climate is okay. In average, on the morning it is 54°F and, in november, 9 days of rain are expected.
- In the month of december the climate is not good. The record temperature this month is 61°F and it rains about 6.3in each month.

Charts: temperature and rainfall in Les Sables-d'Olonne
In the charts below, you can see the following seasonal norms for the city of Les Sables-d'Olonne: the minimum and maximum outdoor temperature, the risk and amount of monthly rainfall, daily average sunshine, sea temperature, and relative humidity for each month of the year.
Outside temperature
Precipitation (rainfall)
Daily sunshine hours
Sea temperature
Humidity
Best time for low prices in Les Sables-d'Olonne
Average price of hiring a car in Les Sables-d'Olonne
On average, it costs $ 55 per day to hire a car in Les Sables-d'Olonne. This price varies by $ 15 depending on the month. In october, hiring a car costs an average of $ 47 per 24 hours, so this is the best time to save money! In contrast, the average price in august is $ 62.
Other cities and places near Les Sables-d'Olonne


Chargement en cours
Legend:
 Les Sables-d'Olonne
 other locations
Les Sables-d'Olonne
other locations